Lithuanian vs Immigrants from Singapore Unemployment Among Seniors over 75 years
COMPARE
Lithuanian
Immigrants from Singapore
Unemployment Among Seniors over 75 years
Unemployment Among Seniors over 75 years Comparison
Lithuanians
Immigrants from Singapore
9.9%
UNEMPLOYMENT AMONG SENIORS OVER 75 YEARS
0.0/ 100
METRIC RATING
298th/ 347
METRIC RANK
8.1%
UNEMPLOYMENT AMONG SENIORS OVER 75 YEARS
99.7/ 100
METRIC RATING
86th/ 347
METRIC RANK
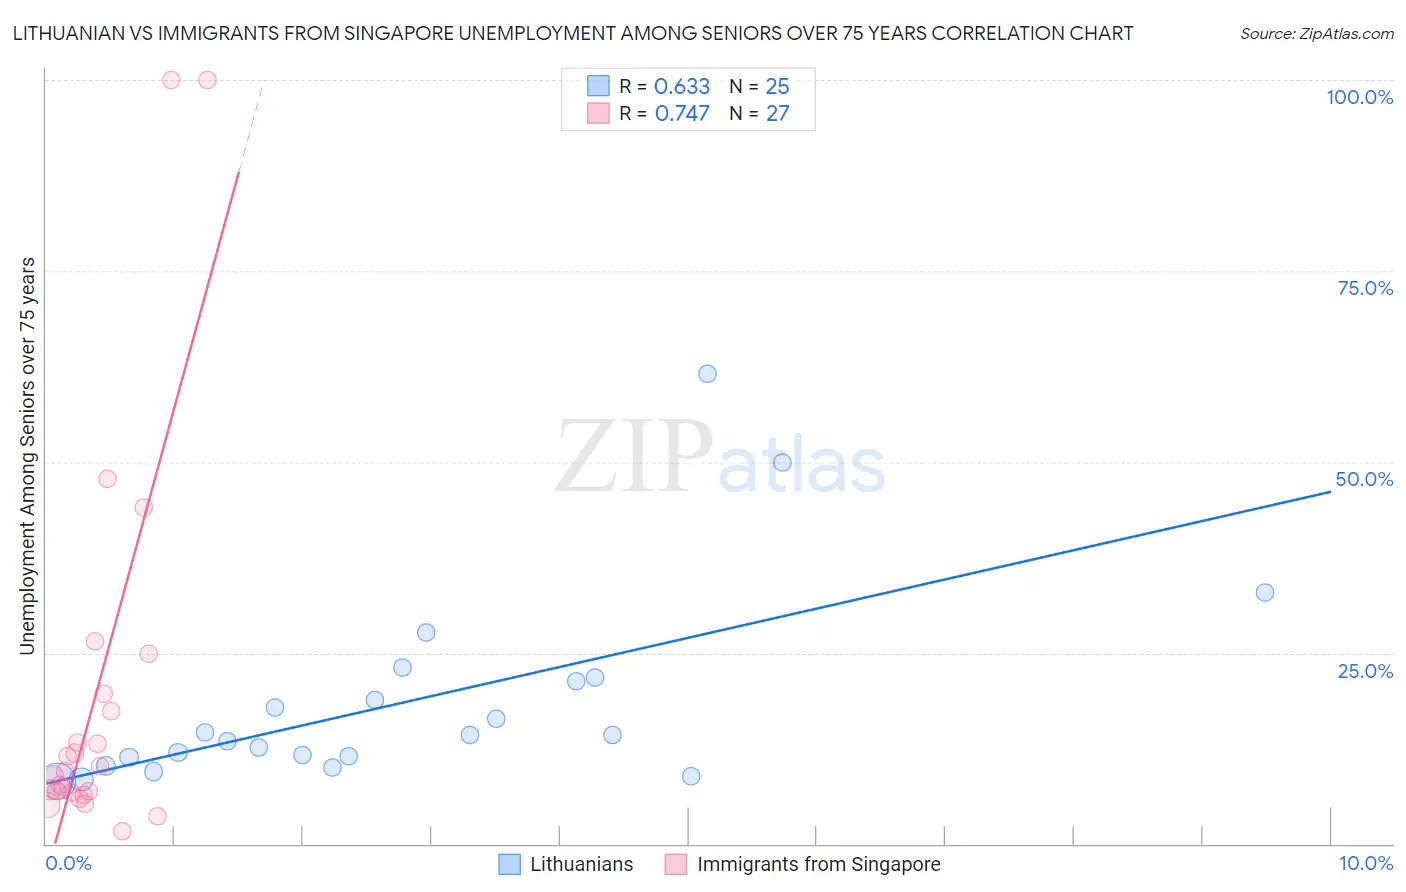
Lithuanian vs Immigrants from Singapore Unemployment Among Seniors over 75 years Correlation Chart
The statistical analysis conducted on geographies consisting of 208,094,168 people shows a significant positive correlation between the proportion of Lithuanians and unemployment rate among seniors over the age of 75 in the United States with a correlation coefficient (R) of 0.633 and weighted average of 9.9%. Similarly, the statistical analysis conducted on geographies consisting of 97,809,221 people shows a strong positive correlation between the proportion of Immigrants from Singapore and unemployment rate among seniors over the age of 75 in the United States with a correlation coefficient (R) of 0.747 and weighted average of 8.1%, a difference of 22.3%.
Unemployment Among Seniors over 75 years Correlation Summary
| Measurement | Lithuanian | Immigrants from Singapore |
| Minimum | 8.1% | 1.6% |
| Maximum | 61.5% | 100.0% |
| Range | 53.4% | 98.4% |
| Mean | 18.5% | 19.6% |
| Median | 14.2% | 9.5% |
| Interquartile 25% (IQ1) | 10.8% | 6.8% |
| Interquartile 75% (IQ3) | 21.5% | 19.7% |
| Interquartile Range (IQR) | 10.8% | 12.9% |
| Standard Deviation (Sample) | 12.9% | 25.7% |
| Standard Deviation (Population) | 12.7% | 25.3% |
Similar Demographics by Unemployment Among Seniors over 75 years
Demographics Similar to Lithuanians by Unemployment Among Seniors over 75 years
In terms of unemployment among seniors over 75 years, the demographic groups most similar to Lithuanians are Belgian (9.9%, a difference of 0.28%), Iraqi (9.9%, a difference of 0.30%), Cherokee (9.8%, a difference of 0.38%), Immigrants from St. Vincent and the Grenadines (9.8%, a difference of 0.46%), and Nonimmigrants (9.8%, a difference of 0.51%).
| Demographics | Rating | Rank | Unemployment Among Seniors over 75 years |
| Scandinavians | 0.0 /100 | #291 | Tragic 9.7% |
| Immigrants | Western Africa | 0.0 /100 | #292 | Tragic 9.8% |
| Norwegians | 0.0 /100 | #293 | Tragic 9.8% |
| Immigrants | Dominica | 0.0 /100 | #294 | Tragic 9.8% |
| Immigrants | Nonimmigrants | 0.0 /100 | #295 | Tragic 9.8% |
| Immigrants | St. Vincent and the Grenadines | 0.0 /100 | #296 | Tragic 9.8% |
| Cherokee | 0.0 /100 | #297 | Tragic 9.8% |
| Lithuanians | 0.0 /100 | #298 | Tragic 9.9% |
| Belgians | 0.0 /100 | #299 | Tragic 9.9% |
| Iraqis | 0.0 /100 | #300 | Tragic 9.9% |
| Welsh | 0.0 /100 | #301 | Tragic 10.0% |
| Finns | 0.0 /100 | #302 | Tragic 10.0% |
| Puget Sound Salish | 0.0 /100 | #303 | Tragic 10.0% |
| Scotch-Irish | 0.0 /100 | #304 | Tragic 10.0% |
| Swedes | 0.0 /100 | #305 | Tragic 10.0% |
Demographics Similar to Immigrants from Singapore by Unemployment Among Seniors over 75 years
In terms of unemployment among seniors over 75 years, the demographic groups most similar to Immigrants from Singapore are Immigrants from Indonesia (8.1%, a difference of 0.090%), U.S. Virgin Islander (8.1%, a difference of 0.15%), Arapaho (8.1%, a difference of 0.24%), Bhutanese (8.0%, a difference of 0.34%), and Cuban (8.0%, a difference of 0.36%).
| Demographics | Rating | Rank | Unemployment Among Seniors over 75 years |
| Immigrants | Japan | 99.7 /100 | #79 | Exceptional 8.0% |
| Immigrants | Australia | 99.7 /100 | #80 | Exceptional 8.0% |
| Cubans | 99.7 /100 | #81 | Exceptional 8.0% |
| Bhutanese | 99.7 /100 | #82 | Exceptional 8.0% |
| Arapaho | 99.7 /100 | #83 | Exceptional 8.1% |
| U.S. Virgin Islanders | 99.7 /100 | #84 | Exceptional 8.1% |
| Immigrants | Indonesia | 99.7 /100 | #85 | Exceptional 8.1% |
| Immigrants | Singapore | 99.7 /100 | #86 | Exceptional 8.1% |
| Basques | 99.5 /100 | #87 | Exceptional 8.1% |
| New Zealanders | 99.5 /100 | #88 | Exceptional 8.1% |
| Immigrants | Korea | 99.5 /100 | #89 | Exceptional 8.1% |
| Immigrants | Vietnam | 99.5 /100 | #90 | Exceptional 8.1% |
| Egyptians | 99.5 /100 | #91 | Exceptional 8.1% |
| Venezuelans | 99.5 /100 | #92 | Exceptional 8.1% |
| Immigrants | Netherlands | 99.5 /100 | #93 | Exceptional 8.1% |