Liberian vs Sri Lankan Unemployment Among Women with Children Under 18 years
COMPARE
Liberian
Sri Lankan
Unemployment Among Women with Children Under 18 years
Unemployment Among Women with Children Under 18 years Comparison
Liberians
Sri Lankans
6.0%
UNEMPLOYMENT AMONG WOMEN WITH CHILDREN UNDER 18 YEARS
0.2/ 100
METRIC RATING
255th/ 347
METRIC RANK
5.2%
UNEMPLOYMENT AMONG WOMEN WITH CHILDREN UNDER 18 YEARS
90.3/ 100
METRIC RATING
103rd/ 347
METRIC RANK
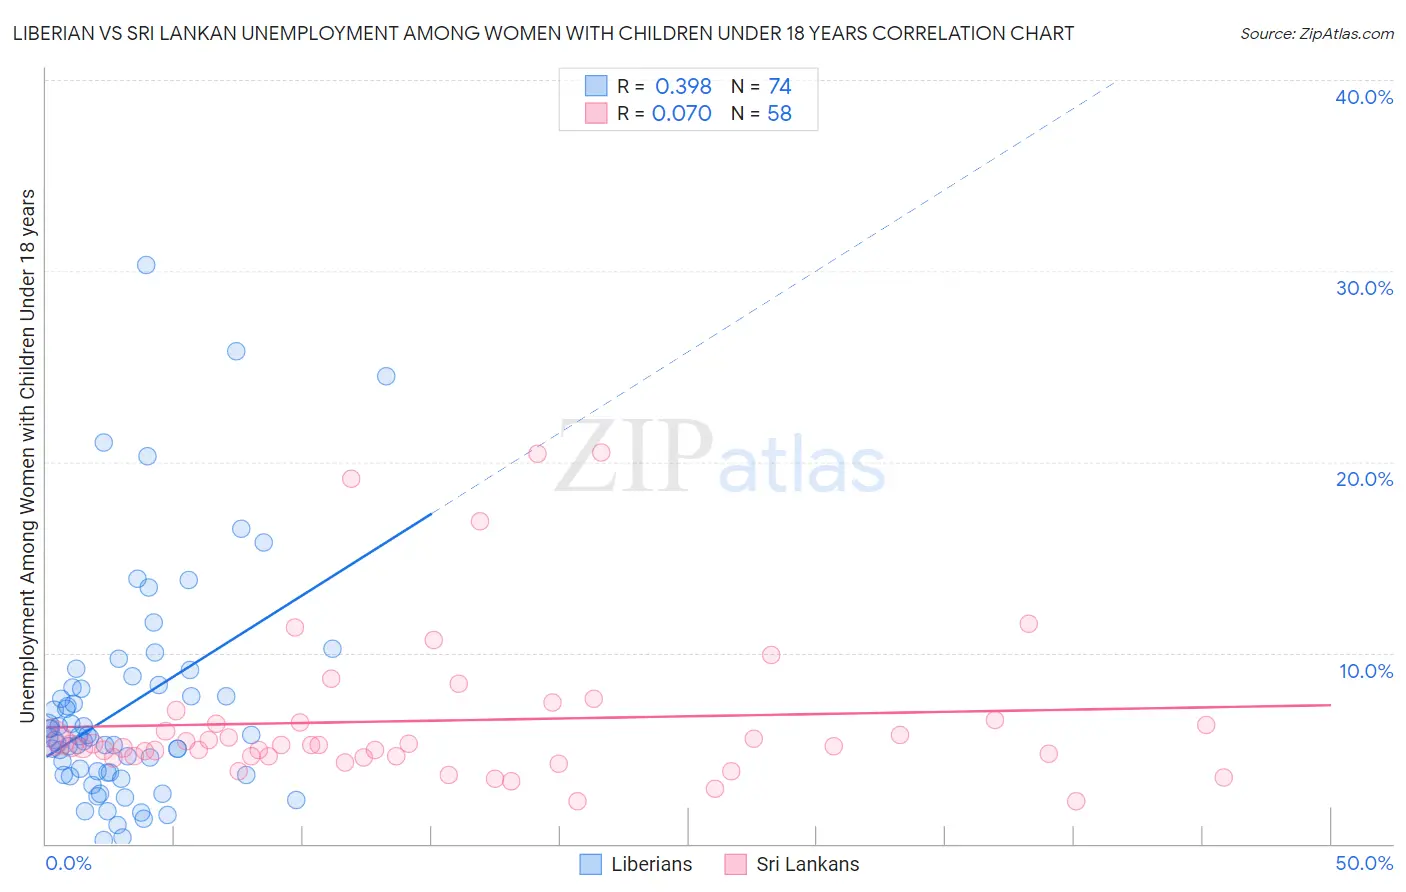
Liberian vs Sri Lankan Unemployment Among Women with Children Under 18 years Correlation Chart
The statistical analysis conducted on geographies consisting of 116,844,166 people shows a mild positive correlation between the proportion of Liberians and unemployment rate among women with children under the age of 18 in the United States with a correlation coefficient (R) of 0.398 and weighted average of 6.0%. Similarly, the statistical analysis conducted on geographies consisting of 422,094,249 people shows a slight positive correlation between the proportion of Sri Lankans and unemployment rate among women with children under the age of 18 in the United States with a correlation coefficient (R) of 0.070 and weighted average of 5.2%, a difference of 15.4%.
Unemployment Among Women with Children Under 18 years Correlation Summary
| Measurement | Liberian | Sri Lankan |
| Minimum | 0.20% | 2.2% |
| Maximum | 30.3% | 20.5% |
| Range | 30.1% | 18.3% |
| Mean | 7.2% | 6.4% |
| Median | 5.6% | 5.2% |
| Interquartile 25% (IQ1) | 3.7% | 4.6% |
| Interquartile 75% (IQ3) | 8.2% | 6.4% |
| Interquartile Range (IQR) | 4.5% | 1.8% |
| Standard Deviation (Sample) | 5.8% | 4.0% |
| Standard Deviation (Population) | 5.8% | 4.0% |
Similar Demographics by Unemployment Among Women with Children Under 18 years
Demographics Similar to Liberians by Unemployment Among Women with Children Under 18 years
In terms of unemployment among women with children under 18 years, the demographic groups most similar to Liberians are Nepalese (6.0%, a difference of 0.080%), Immigrants from the Azores (6.0%, a difference of 0.39%), Bermudan (6.1%, a difference of 0.61%), Immigrants from Nigeria (6.1%, a difference of 0.79%), and Immigrants from Congo (6.0%, a difference of 1.1%).
| Demographics | Rating | Rank | Unemployment Among Women with Children Under 18 years |
| Delaware | 0.8 /100 | #248 | Tragic 5.9% |
| Immigrants | Cameroon | 0.8 /100 | #249 | Tragic 5.9% |
| Immigrants | Cabo Verde | 0.7 /100 | #250 | Tragic 5.9% |
| Ute | 0.7 /100 | #251 | Tragic 5.9% |
| Seminole | 0.5 /100 | #252 | Tragic 6.0% |
| Immigrants | Congo | 0.4 /100 | #253 | Tragic 6.0% |
| Immigrants | Azores | 0.3 /100 | #254 | Tragic 6.0% |
| Liberians | 0.2 /100 | #255 | Tragic 6.0% |
| Nepalese | 0.2 /100 | #256 | Tragic 6.0% |
| Bermudans | 0.1 /100 | #257 | Tragic 6.1% |
| Immigrants | Nigeria | 0.1 /100 | #258 | Tragic 6.1% |
| Ottawa | 0.1 /100 | #259 | Tragic 6.1% |
| Nigerians | 0.1 /100 | #260 | Tragic 6.1% |
| Immigrants | Liberia | 0.1 /100 | #261 | Tragic 6.1% |
| Immigrants | Trinidad and Tobago | 0.1 /100 | #262 | Tragic 6.1% |
Demographics Similar to Sri Lankans by Unemployment Among Women with Children Under 18 years
In terms of unemployment among women with children under 18 years, the demographic groups most similar to Sri Lankans are Immigrants from Switzerland (5.2%, a difference of 0.040%), Immigrants from France (5.2%, a difference of 0.060%), Pakistani (5.2%, a difference of 0.080%), Slavic (5.2%, a difference of 0.090%), and Iranian (5.2%, a difference of 0.13%).
| Demographics | Rating | Rank | Unemployment Among Women with Children Under 18 years |
| Immigrants | Albania | 92.2 /100 | #96 | Exceptional 5.2% |
| Palestinians | 92.2 /100 | #97 | Exceptional 5.2% |
| Immigrants | Vietnam | 92.0 /100 | #98 | Exceptional 5.2% |
| Cubans | 91.8 /100 | #99 | Exceptional 5.2% |
| Immigrants | Greece | 91.4 /100 | #100 | Exceptional 5.2% |
| Immigrants | Netherlands | 91.0 /100 | #101 | Exceptional 5.2% |
| Immigrants | Cuba | 90.9 /100 | #102 | Exceptional 5.2% |
| Sri Lankans | 90.3 /100 | #103 | Exceptional 5.2% |
| Immigrants | Switzerland | 90.1 /100 | #104 | Exceptional 5.2% |
| Immigrants | France | 90.0 /100 | #105 | Excellent 5.2% |
| Pakistanis | 89.9 /100 | #106 | Excellent 5.2% |
| Slavs | 89.8 /100 | #107 | Excellent 5.2% |
| Iranians | 89.7 /100 | #108 | Excellent 5.2% |
| Immigrants | Russia | 89.0 /100 | #109 | Excellent 5.2% |
| Immigrants | Czechoslovakia | 88.9 /100 | #110 | Excellent 5.2% |