Liberian vs Yuman Unemployment Among Women with Children Under 18 years
COMPARE
Liberian
Yuman
Unemployment Among Women with Children Under 18 years
Unemployment Among Women with Children Under 18 years Comparison
Liberians
Yuman
6.0%
UNEMPLOYMENT AMONG WOMEN WITH CHILDREN UNDER 18 YEARS
0.2/ 100
METRIC RATING
255th/ 347
METRIC RANK
9.8%
UNEMPLOYMENT AMONG WOMEN WITH CHILDREN UNDER 18 YEARS
0.0/ 100
METRIC RATING
345th/ 347
METRIC RANK
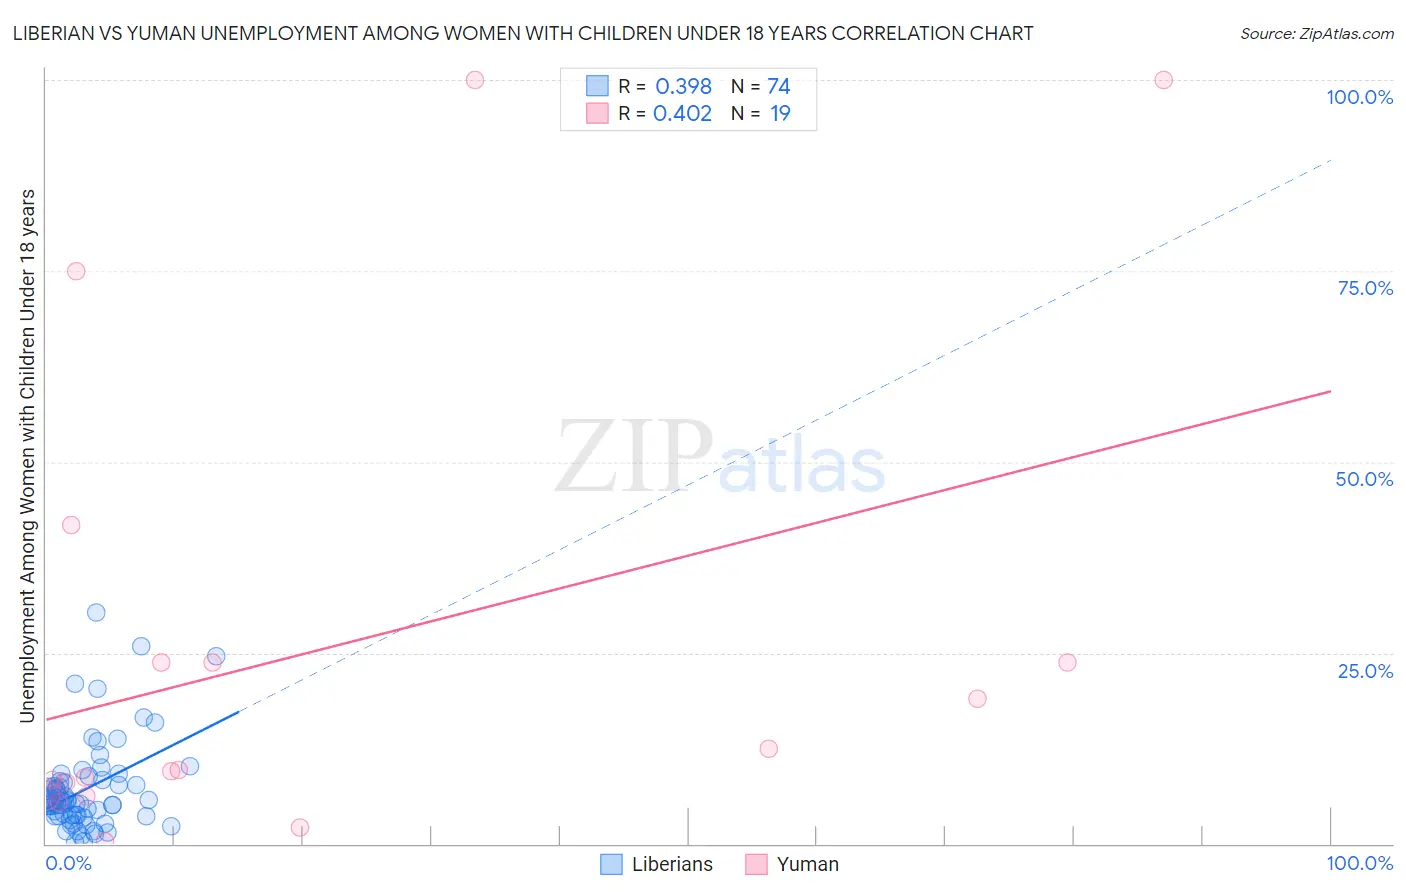
Liberian vs Yuman Unemployment Among Women with Children Under 18 years Correlation Chart
The statistical analysis conducted on geographies consisting of 116,844,166 people shows a mild positive correlation between the proportion of Liberians and unemployment rate among women with children under the age of 18 in the United States with a correlation coefficient (R) of 0.398 and weighted average of 6.0%. Similarly, the statistical analysis conducted on geographies consisting of 40,332,317 people shows a moderate positive correlation between the proportion of Yuman and unemployment rate among women with children under the age of 18 in the United States with a correlation coefficient (R) of 0.402 and weighted average of 9.8%, a difference of 61.7%.
Unemployment Among Women with Children Under 18 years Correlation Summary
| Measurement | Liberian | Yuman |
| Minimum | 0.20% | 0.30% |
| Maximum | 30.3% | 100.0% |
| Range | 30.1% | 99.7% |
| Mean | 7.2% | 25.5% |
| Median | 5.6% | 9.6% |
| Interquartile 25% (IQ1) | 3.7% | 6.3% |
| Interquartile 75% (IQ3) | 8.2% | 23.8% |
| Interquartile Range (IQR) | 4.5% | 17.5% |
| Standard Deviation (Sample) | 5.8% | 31.4% |
| Standard Deviation (Population) | 5.8% | 30.6% |
Similar Demographics by Unemployment Among Women with Children Under 18 years
Demographics Similar to Liberians by Unemployment Among Women with Children Under 18 years
In terms of unemployment among women with children under 18 years, the demographic groups most similar to Liberians are Nepalese (6.0%, a difference of 0.080%), Immigrants from the Azores (6.0%, a difference of 0.39%), Bermudan (6.1%, a difference of 0.61%), Immigrants from Nigeria (6.1%, a difference of 0.79%), and Immigrants from Congo (6.0%, a difference of 1.1%).
| Demographics | Rating | Rank | Unemployment Among Women with Children Under 18 years |
| Delaware | 0.8 /100 | #248 | Tragic 5.9% |
| Immigrants | Cameroon | 0.8 /100 | #249 | Tragic 5.9% |
| Immigrants | Cabo Verde | 0.7 /100 | #250 | Tragic 5.9% |
| Ute | 0.7 /100 | #251 | Tragic 5.9% |
| Seminole | 0.5 /100 | #252 | Tragic 6.0% |
| Immigrants | Congo | 0.4 /100 | #253 | Tragic 6.0% |
| Immigrants | Azores | 0.3 /100 | #254 | Tragic 6.0% |
| Liberians | 0.2 /100 | #255 | Tragic 6.0% |
| Nepalese | 0.2 /100 | #256 | Tragic 6.0% |
| Bermudans | 0.1 /100 | #257 | Tragic 6.1% |
| Immigrants | Nigeria | 0.1 /100 | #258 | Tragic 6.1% |
| Ottawa | 0.1 /100 | #259 | Tragic 6.1% |
| Nigerians | 0.1 /100 | #260 | Tragic 6.1% |
| Immigrants | Liberia | 0.1 /100 | #261 | Tragic 6.1% |
| Immigrants | Trinidad and Tobago | 0.1 /100 | #262 | Tragic 6.1% |
Demographics Similar to Yuman by Unemployment Among Women with Children Under 18 years
In terms of unemployment among women with children under 18 years, the demographic groups most similar to Yuman are Inupiat (9.6%, a difference of 1.9%), Arapaho (9.2%, a difference of 6.2%), Puerto Rican (9.0%, a difference of 8.4%), Tohono O'odham (8.9%, a difference of 10.2%), and Yup'ik (11.0%, a difference of 12.9%).
| Demographics | Rating | Rank | Unemployment Among Women with Children Under 18 years |
| Immigrants | Dominican Republic | 0.0 /100 | #333 | Tragic 7.5% |
| Cheyenne | 0.0 /100 | #334 | Tragic 7.8% |
| Apache | 0.0 /100 | #335 | Tragic 7.9% |
| Sioux | 0.0 /100 | #336 | Tragic 7.9% |
| Yakama | 0.0 /100 | #337 | Tragic 8.1% |
| Immigrants | Yemen | 0.0 /100 | #338 | Tragic 8.2% |
| Navajo | 0.0 /100 | #339 | Tragic 8.2% |
| Crow | 0.0 /100 | #340 | Tragic 8.2% |
| Tohono O'odham | 0.0 /100 | #341 | Tragic 8.9% |
| Puerto Ricans | 0.0 /100 | #342 | Tragic 9.0% |
| Arapaho | 0.0 /100 | #343 | Tragic 9.2% |
| Inupiat | 0.0 /100 | #344 | Tragic 9.6% |
| Yuman | 0.0 /100 | #345 | Tragic 9.8% |
| Yup'ik | 0.0 /100 | #346 | Tragic 11.0% |
| Pima | 0.0 /100 | #347 | Tragic 11.7% |