Immigrants from Africa vs Sri Lankan Unemployment Among Women with Children Under 18 years
COMPARE
Immigrants from Africa
Sri Lankan
Unemployment Among Women with Children Under 18 years
Unemployment Among Women with Children Under 18 years Comparison
Immigrants from Africa
Sri Lankans
5.8%
UNEMPLOYMENT AMONG WOMEN WITH CHILDREN UNDER 18 YEARS
3.1/ 100
METRIC RATING
231st/ 347
METRIC RANK
5.2%
UNEMPLOYMENT AMONG WOMEN WITH CHILDREN UNDER 18 YEARS
90.3/ 100
METRIC RATING
103rd/ 347
METRIC RANK
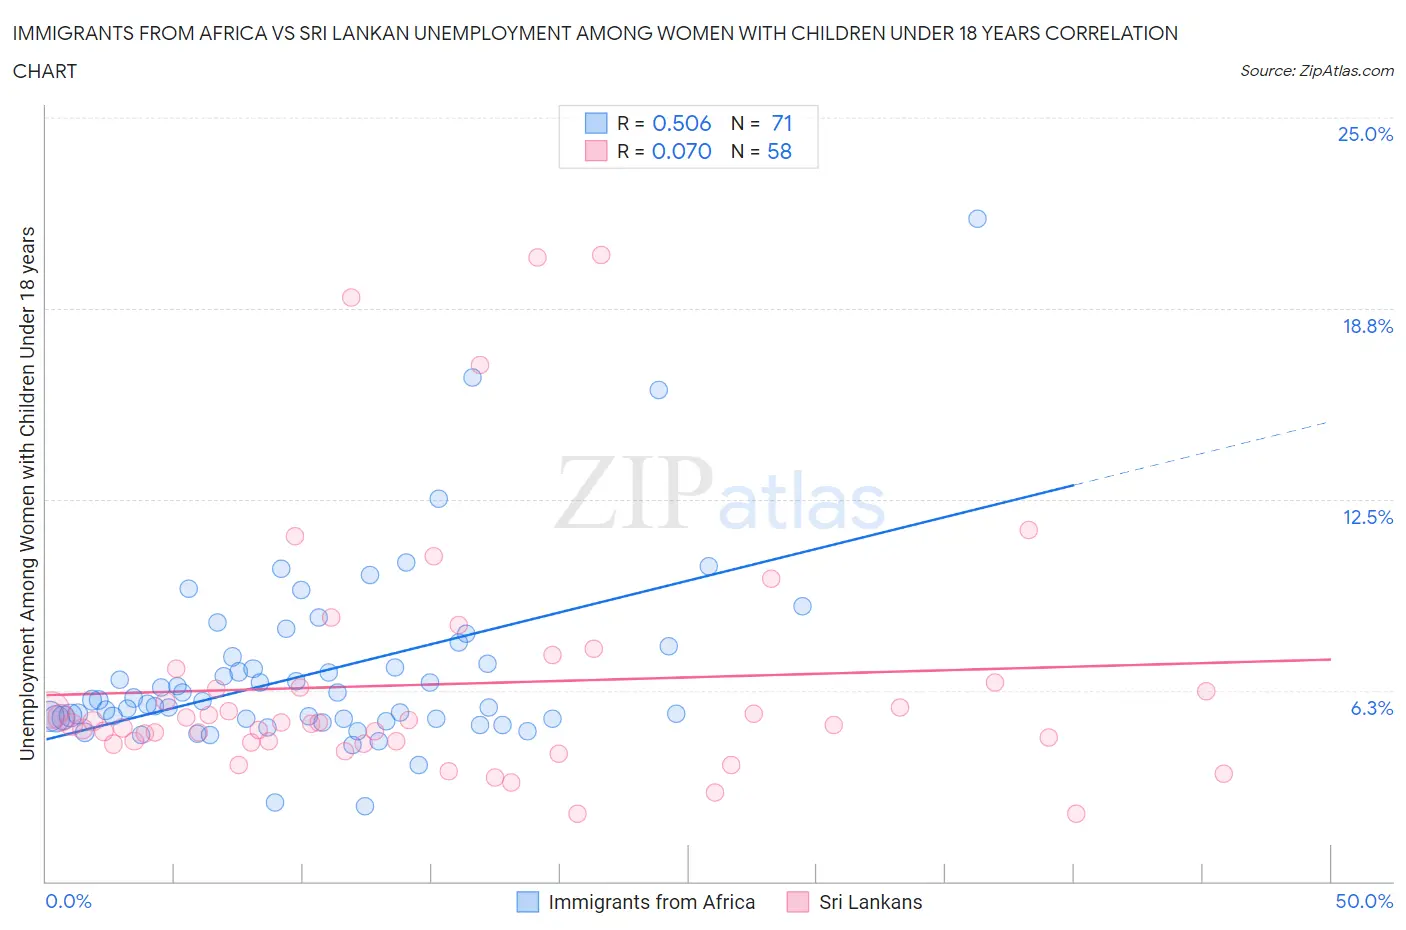
Immigrants from Africa vs Sri Lankan Unemployment Among Women with Children Under 18 years Correlation Chart
The statistical analysis conducted on geographies consisting of 447,518,413 people shows a substantial positive correlation between the proportion of Immigrants from Africa and unemployment rate among women with children under the age of 18 in the United States with a correlation coefficient (R) of 0.506 and weighted average of 5.8%. Similarly, the statistical analysis conducted on geographies consisting of 422,094,249 people shows a slight positive correlation between the proportion of Sri Lankans and unemployment rate among women with children under the age of 18 in the United States with a correlation coefficient (R) of 0.070 and weighted average of 5.2%, a difference of 10.5%.
Unemployment Among Women with Children Under 18 years Correlation Summary
| Measurement | Immigrants from Africa | Sri Lankan |
| Minimum | 2.5% | 2.2% |
| Maximum | 21.7% | 20.5% |
| Range | 19.2% | 18.3% |
| Mean | 6.8% | 6.4% |
| Median | 5.9% | 5.2% |
| Interquartile 25% (IQ1) | 5.3% | 4.6% |
| Interquartile 75% (IQ3) | 7.3% | 6.4% |
| Interquartile Range (IQR) | 2.0% | 1.8% |
| Standard Deviation (Sample) | 3.0% | 4.0% |
| Standard Deviation (Population) | 3.0% | 4.0% |
Similar Demographics by Unemployment Among Women with Children Under 18 years
Demographics Similar to Immigrants from Africa by Unemployment Among Women with Children Under 18 years
In terms of unemployment among women with children under 18 years, the demographic groups most similar to Immigrants from Africa are Creek (5.8%, a difference of 0.030%), Spanish American (5.8%, a difference of 0.050%), Immigrants from South America (5.8%, a difference of 0.060%), Immigrants from Panama (5.8%, a difference of 0.12%), and Guamanian/Chamorro (5.8%, a difference of 0.15%).
| Demographics | Rating | Rank | Unemployment Among Women with Children Under 18 years |
| Immigrants | Syria | 4.6 /100 | #224 | Tragic 5.7% |
| Armenians | 4.5 /100 | #225 | Tragic 5.7% |
| Cherokee | 4.3 /100 | #226 | Tragic 5.7% |
| Sierra Leoneans | 3.8 /100 | #227 | Tragic 5.8% |
| Somalis | 3.5 /100 | #228 | Tragic 5.8% |
| Immigrants | Panama | 3.4 /100 | #229 | Tragic 5.8% |
| Immigrants | South America | 3.2 /100 | #230 | Tragic 5.8% |
| Immigrants | Africa | 3.1 /100 | #231 | Tragic 5.8% |
| Creek | 3.1 /100 | #232 | Tragic 5.8% |
| Spanish Americans | 3.1 /100 | #233 | Tragic 5.8% |
| Guamanians/Chamorros | 2.9 /100 | #234 | Tragic 5.8% |
| Immigrants | Middle Africa | 2.8 /100 | #235 | Tragic 5.8% |
| Alsatians | 2.5 /100 | #236 | Tragic 5.8% |
| Immigrants | Lebanon | 2.4 /100 | #237 | Tragic 5.8% |
| Immigrants | Somalia | 2.2 /100 | #238 | Tragic 5.8% |
Demographics Similar to Sri Lankans by Unemployment Among Women with Children Under 18 years
In terms of unemployment among women with children under 18 years, the demographic groups most similar to Sri Lankans are Immigrants from Switzerland (5.2%, a difference of 0.040%), Immigrants from France (5.2%, a difference of 0.060%), Pakistani (5.2%, a difference of 0.080%), Slavic (5.2%, a difference of 0.090%), and Iranian (5.2%, a difference of 0.13%).
| Demographics | Rating | Rank | Unemployment Among Women with Children Under 18 years |
| Immigrants | Albania | 92.2 /100 | #96 | Exceptional 5.2% |
| Palestinians | 92.2 /100 | #97 | Exceptional 5.2% |
| Immigrants | Vietnam | 92.0 /100 | #98 | Exceptional 5.2% |
| Cubans | 91.8 /100 | #99 | Exceptional 5.2% |
| Immigrants | Greece | 91.4 /100 | #100 | Exceptional 5.2% |
| Immigrants | Netherlands | 91.0 /100 | #101 | Exceptional 5.2% |
| Immigrants | Cuba | 90.9 /100 | #102 | Exceptional 5.2% |
| Sri Lankans | 90.3 /100 | #103 | Exceptional 5.2% |
| Immigrants | Switzerland | 90.1 /100 | #104 | Exceptional 5.2% |
| Immigrants | France | 90.0 /100 | #105 | Excellent 5.2% |
| Pakistanis | 89.9 /100 | #106 | Excellent 5.2% |
| Slavs | 89.8 /100 | #107 | Excellent 5.2% |
| Iranians | 89.7 /100 | #108 | Excellent 5.2% |
| Immigrants | Russia | 89.0 /100 | #109 | Excellent 5.2% |
| Immigrants | Czechoslovakia | 88.9 /100 | #110 | Excellent 5.2% |