Liberian vs Spanish American Unemployment Among Ages 45 to 54 years
COMPARE
Liberian
Spanish American
Unemployment Among Ages 45 to 54 years
Unemployment Among Ages 45 to 54 years Comparison
Liberians
Spanish Americans
4.6%
UNEMPLOYMENT AMONG AGES 45 TO 54 YEARS
18.7/ 100
METRIC RATING
203rd/ 347
METRIC RANK
4.7%
UNEMPLOYMENT AMONG AGES 45 TO 54 YEARS
1.4/ 100
METRIC RATING
239th/ 347
METRIC RANK
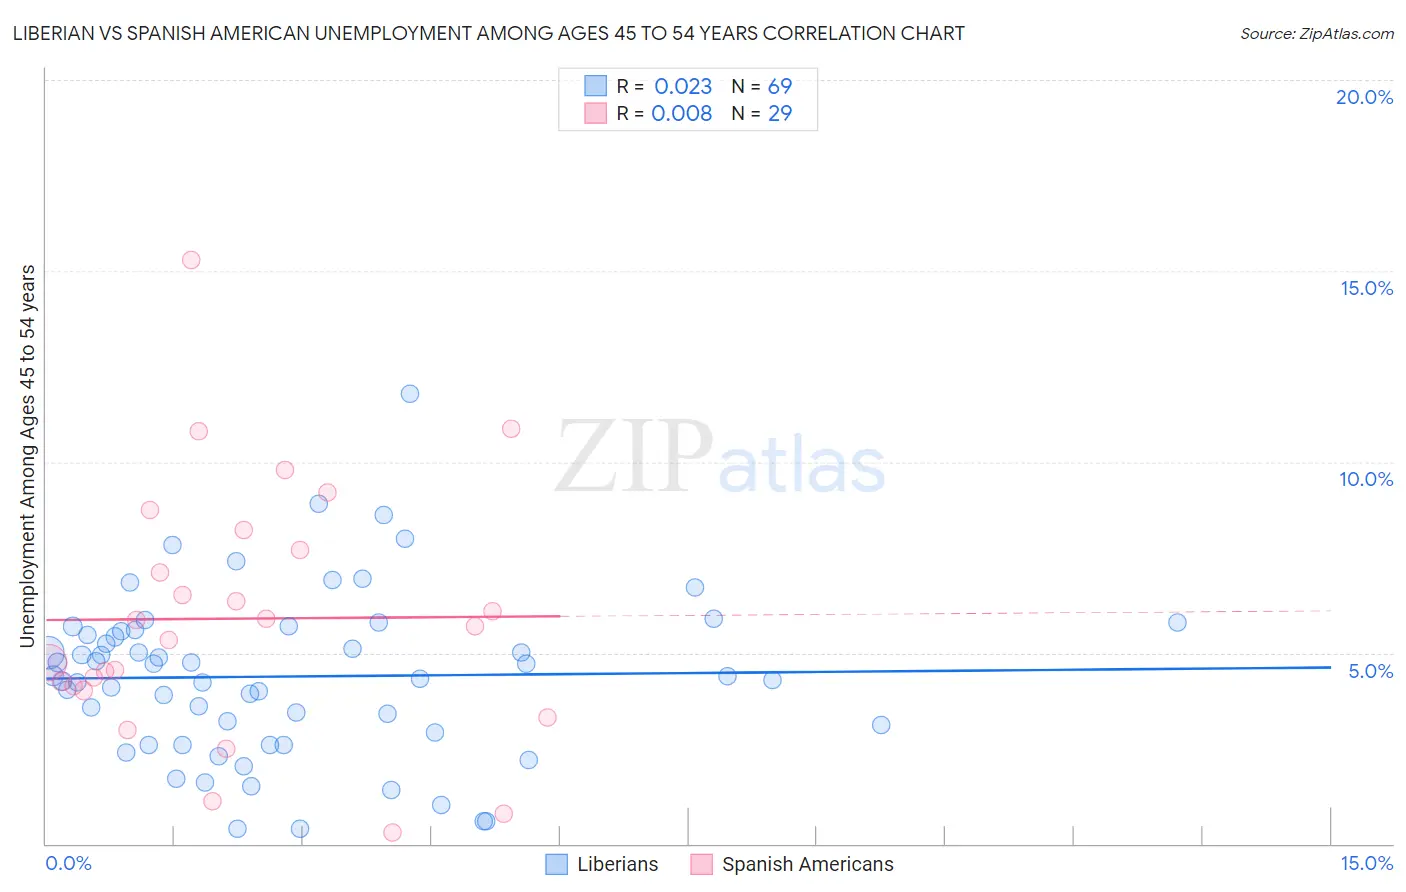
Liberian vs Spanish American Unemployment Among Ages 45 to 54 years Correlation Chart
The statistical analysis conducted on geographies consisting of 117,212,866 people shows no correlation between the proportion of Liberians and unemployment rate among population between the ages 45 and 54 in the United States with a correlation coefficient (R) of 0.023 and weighted average of 4.6%. Similarly, the statistical analysis conducted on geographies consisting of 102,534,549 people shows no correlation between the proportion of Spanish Americans and unemployment rate among population between the ages 45 and 54 in the United States with a correlation coefficient (R) of 0.008 and weighted average of 4.7%, a difference of 3.2%.
Unemployment Among Ages 45 to 54 years Correlation Summary
| Measurement | Liberian | Spanish American |
| Minimum | 0.40% | 0.30% |
| Maximum | 11.8% | 15.3% |
| Range | 11.4% | 15.0% |
| Mean | 4.4% | 5.9% |
| Median | 4.4% | 5.7% |
| Interquartile 25% (IQ1) | 2.8% | 4.1% |
| Interquartile 75% (IQ3) | 5.6% | 8.0% |
| Interquartile Range (IQR) | 2.8% | 3.9% |
| Standard Deviation (Sample) | 2.2% | 3.3% |
| Standard Deviation (Population) | 2.1% | 3.2% |
Similar Demographics by Unemployment Among Ages 45 to 54 years
Demographics Similar to Liberians by Unemployment Among Ages 45 to 54 years
In terms of unemployment among ages 45 to 54 years, the demographic groups most similar to Liberians are Immigrants from Peru (4.6%, a difference of 0.030%), Immigrants from Costa Rica (4.6%, a difference of 0.070%), Immigrants from Denmark (4.6%, a difference of 0.080%), Brazilian (4.6%, a difference of 0.10%), and Immigrants from Morocco (4.6%, a difference of 0.15%).
| Demographics | Rating | Rank | Unemployment Among Ages 45 to 54 years |
| Estonians | 31.2 /100 | #196 | Fair 4.6% |
| Albanians | 31.1 /100 | #197 | Fair 4.6% |
| Immigrants | Belarus | 30.6 /100 | #198 | Fair 4.6% |
| Brazilians | 20.1 /100 | #199 | Fair 4.6% |
| Immigrants | Denmark | 19.8 /100 | #200 | Poor 4.6% |
| Immigrants | Costa Rica | 19.7 /100 | #201 | Poor 4.6% |
| Immigrants | Peru | 19.1 /100 | #202 | Poor 4.6% |
| Liberians | 18.7 /100 | #203 | Poor 4.6% |
| Immigrants | Morocco | 16.8 /100 | #204 | Poor 4.6% |
| Immigrants | Greece | 16.2 /100 | #205 | Poor 4.6% |
| Immigrants | Switzerland | 14.0 /100 | #206 | Poor 4.6% |
| Arabs | 13.7 /100 | #207 | Poor 4.6% |
| Immigrants | Africa | 13.6 /100 | #208 | Poor 4.6% |
| Immigrants | Nigeria | 13.3 /100 | #209 | Poor 4.6% |
| Immigrants | South America | 12.2 /100 | #210 | Poor 4.6% |
Demographics Similar to Spanish Americans by Unemployment Among Ages 45 to 54 years
In terms of unemployment among ages 45 to 54 years, the demographic groups most similar to Spanish Americans are Yaqui (4.7%, a difference of 0.0%), Immigrants from Iraq (4.7%, a difference of 0.030%), Delaware (4.8%, a difference of 0.10%), Central American (4.8%, a difference of 0.10%), and Alsatian (4.7%, a difference of 0.17%).
| Demographics | Rating | Rank | Unemployment Among Ages 45 to 54 years |
| Ottawa | 2.7 /100 | #232 | Tragic 4.7% |
| Immigrants | Immigrants | 2.6 /100 | #233 | Tragic 4.7% |
| Soviet Union | 2.6 /100 | #234 | Tragic 4.7% |
| Cree | 2.3 /100 | #235 | Tragic 4.7% |
| Tlingit-Haida | 2.3 /100 | #236 | Tragic 4.7% |
| Alsatians | 1.6 /100 | #237 | Tragic 4.7% |
| Yaqui | 1.4 /100 | #238 | Tragic 4.7% |
| Spanish Americans | 1.4 /100 | #239 | Tragic 4.7% |
| Immigrants | Iraq | 1.3 /100 | #240 | Tragic 4.7% |
| Delaware | 1.3 /100 | #241 | Tragic 4.8% |
| Central Americans | 1.3 /100 | #242 | Tragic 4.8% |
| Portuguese | 1.1 /100 | #243 | Tragic 4.8% |
| Seminole | 1.1 /100 | #244 | Tragic 4.8% |
| Immigrants | Albania | 0.9 /100 | #245 | Tragic 4.8% |
| Immigrants | Syria | 0.9 /100 | #246 | Tragic 4.8% |