Iranian vs Spanish American Unemployment Among Ages 45 to 54 years
COMPARE
Iranian
Spanish American
Unemployment Among Ages 45 to 54 years
Unemployment Among Ages 45 to 54 years Comparison
Iranians
Spanish Americans
4.4%
UNEMPLOYMENT AMONG AGES 45 TO 54 YEARS
92.5/ 100
METRIC RATING
106th/ 347
METRIC RANK
4.7%
UNEMPLOYMENT AMONG AGES 45 TO 54 YEARS
1.4/ 100
METRIC RATING
239th/ 347
METRIC RANK
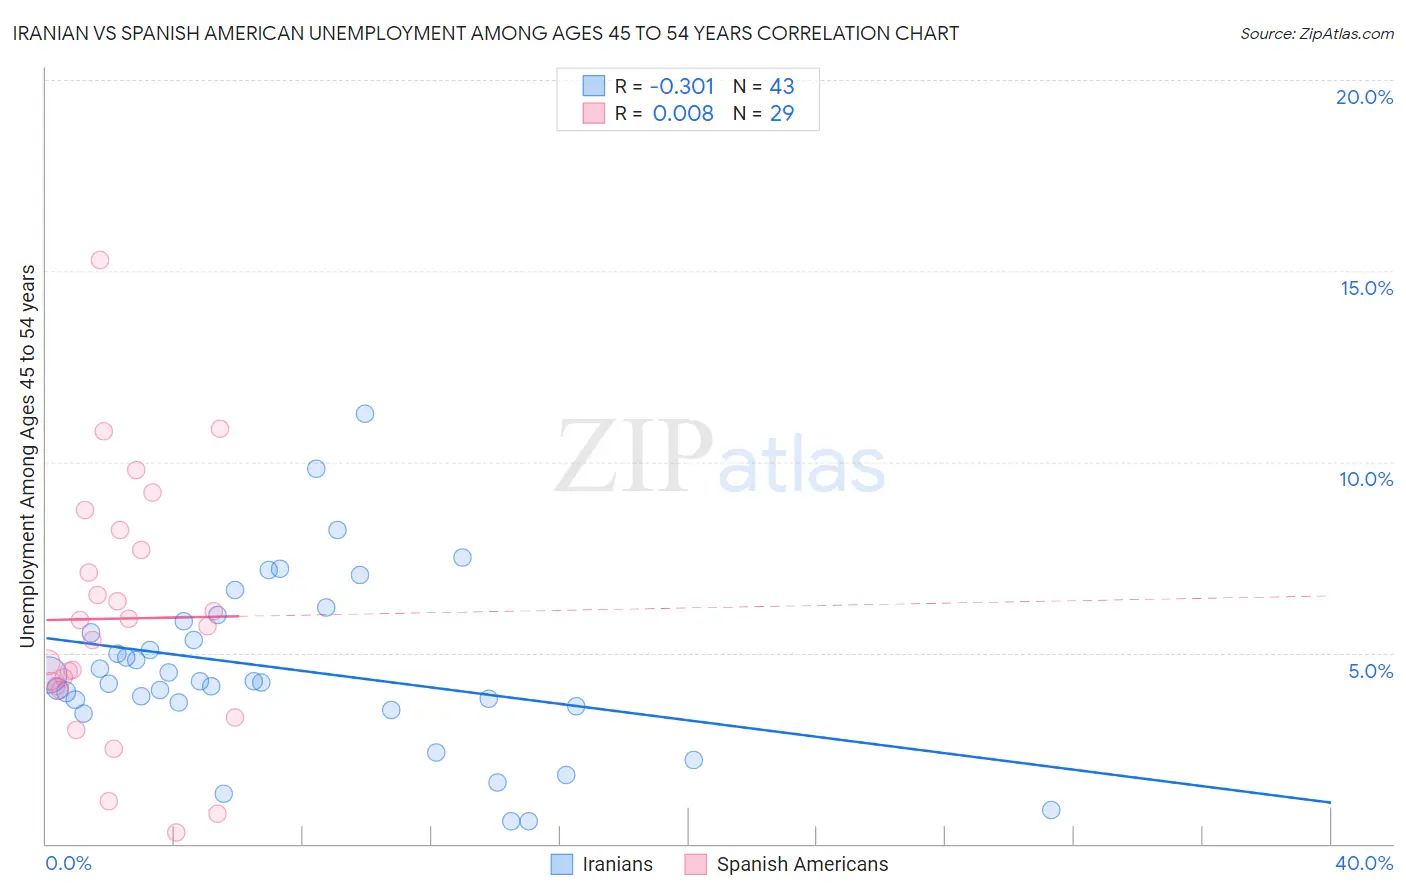
Iranian vs Spanish American Unemployment Among Ages 45 to 54 years Correlation Chart
The statistical analysis conducted on geographies consisting of 311,597,044 people shows a mild negative correlation between the proportion of Iranians and unemployment rate among population between the ages 45 and 54 in the United States with a correlation coefficient (R) of -0.301 and weighted average of 4.4%. Similarly, the statistical analysis conducted on geographies consisting of 102,534,549 people shows no correlation between the proportion of Spanish Americans and unemployment rate among population between the ages 45 and 54 in the United States with a correlation coefficient (R) of 0.008 and weighted average of 4.7%, a difference of 8.2%.
Unemployment Among Ages 45 to 54 years Correlation Summary
| Measurement | Iranian | Spanish American |
| Minimum | 0.60% | 0.30% |
| Maximum | 11.3% | 15.3% |
| Range | 10.7% | 15.0% |
| Mean | 4.6% | 5.9% |
| Median | 4.3% | 5.7% |
| Interquartile 25% (IQ1) | 3.6% | 4.1% |
| Interquartile 75% (IQ3) | 5.8% | 8.0% |
| Interquartile Range (IQR) | 2.2% | 3.9% |
| Standard Deviation (Sample) | 2.3% | 3.3% |
| Standard Deviation (Population) | 2.2% | 3.2% |
Similar Demographics by Unemployment Among Ages 45 to 54 years
Demographics Similar to Iranians by Unemployment Among Ages 45 to 54 years
In terms of unemployment among ages 45 to 54 years, the demographic groups most similar to Iranians are Immigrants from South Africa (4.4%, a difference of 0.0%), Immigrants from Kenya (4.4%, a difference of 0.060%), Russian (4.4%, a difference of 0.060%), Immigrants from Sweden (4.4%, a difference of 0.090%), and New Zealander (4.4%, a difference of 0.090%).
| Demographics | Rating | Rank | Unemployment Among Ages 45 to 54 years |
| Immigrants | Burma/Myanmar | 94.9 /100 | #99 | Exceptional 4.4% |
| Immigrants | Eritrea | 94.7 /100 | #100 | Exceptional 4.4% |
| Immigrants | North America | 93.9 /100 | #101 | Exceptional 4.4% |
| Sri Lankans | 93.7 /100 | #102 | Exceptional 4.4% |
| Icelanders | 93.5 /100 | #103 | Exceptional 4.4% |
| Immigrants | Sweden | 93.0 /100 | #104 | Exceptional 4.4% |
| Immigrants | Kenya | 92.8 /100 | #105 | Exceptional 4.4% |
| Iranians | 92.5 /100 | #106 | Exceptional 4.4% |
| Immigrants | South Africa | 92.5 /100 | #107 | Exceptional 4.4% |
| Russians | 92.1 /100 | #108 | Exceptional 4.4% |
| New Zealanders | 91.9 /100 | #109 | Exceptional 4.4% |
| Immigrants | England | 91.3 /100 | #110 | Exceptional 4.4% |
| Immigrants | Nicaragua | 91.3 /100 | #111 | Exceptional 4.4% |
| Immigrants | Saudi Arabia | 91.1 /100 | #112 | Exceptional 4.4% |
| French Canadians | 91.0 /100 | #113 | Exceptional 4.4% |
Demographics Similar to Spanish Americans by Unemployment Among Ages 45 to 54 years
In terms of unemployment among ages 45 to 54 years, the demographic groups most similar to Spanish Americans are Yaqui (4.7%, a difference of 0.0%), Immigrants from Iraq (4.7%, a difference of 0.030%), Delaware (4.8%, a difference of 0.10%), Central American (4.8%, a difference of 0.10%), and Alsatian (4.7%, a difference of 0.17%).
| Demographics | Rating | Rank | Unemployment Among Ages 45 to 54 years |
| Ottawa | 2.7 /100 | #232 | Tragic 4.7% |
| Immigrants | Immigrants | 2.6 /100 | #233 | Tragic 4.7% |
| Soviet Union | 2.6 /100 | #234 | Tragic 4.7% |
| Cree | 2.3 /100 | #235 | Tragic 4.7% |
| Tlingit-Haida | 2.3 /100 | #236 | Tragic 4.7% |
| Alsatians | 1.6 /100 | #237 | Tragic 4.7% |
| Yaqui | 1.4 /100 | #238 | Tragic 4.7% |
| Spanish Americans | 1.4 /100 | #239 | Tragic 4.7% |
| Immigrants | Iraq | 1.3 /100 | #240 | Tragic 4.7% |
| Delaware | 1.3 /100 | #241 | Tragic 4.8% |
| Central Americans | 1.3 /100 | #242 | Tragic 4.8% |
| Portuguese | 1.1 /100 | #243 | Tragic 4.8% |
| Seminole | 1.1 /100 | #244 | Tragic 4.8% |
| Immigrants | Albania | 0.9 /100 | #245 | Tragic 4.8% |
| Immigrants | Syria | 0.9 /100 | #246 | Tragic 4.8% |