Immigrants from Ireland vs Spanish American Unemployment Among Ages 45 to 54 years
COMPARE
Immigrants from Ireland
Spanish American
Unemployment Among Ages 45 to 54 years
Unemployment Among Ages 45 to 54 years Comparison
Immigrants from Ireland
Spanish Americans
4.7%
UNEMPLOYMENT AMONG AGES 45 TO 54 YEARS
2.7/ 100
METRIC RATING
231st/ 347
METRIC RANK
4.7%
UNEMPLOYMENT AMONG AGES 45 TO 54 YEARS
1.4/ 100
METRIC RATING
239th/ 347
METRIC RANK
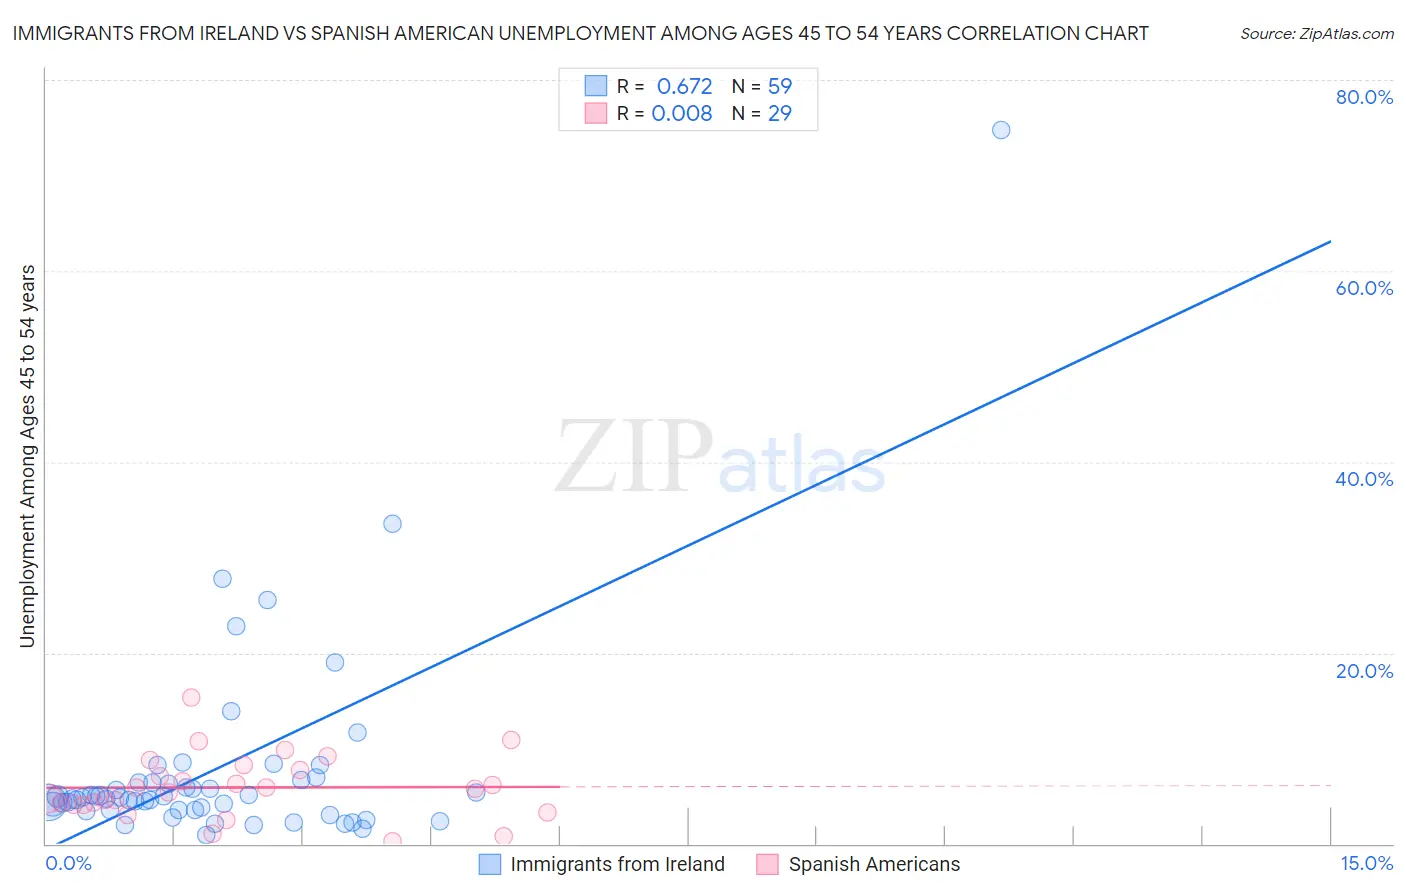
Immigrants from Ireland vs Spanish American Unemployment Among Ages 45 to 54 years Correlation Chart
The statistical analysis conducted on geographies consisting of 237,473,995 people shows a significant positive correlation between the proportion of Immigrants from Ireland and unemployment rate among population between the ages 45 and 54 in the United States with a correlation coefficient (R) of 0.672 and weighted average of 4.7%. Similarly, the statistical analysis conducted on geographies consisting of 102,534,549 people shows no correlation between the proportion of Spanish Americans and unemployment rate among population between the ages 45 and 54 in the United States with a correlation coefficient (R) of 0.008 and weighted average of 4.7%, a difference of 0.78%.
Unemployment Among Ages 45 to 54 years Correlation Summary
| Measurement | Immigrants from Ireland | Spanish American |
| Minimum | 0.96% | 0.30% |
| Maximum | 74.7% | 15.3% |
| Range | 73.7% | 15.0% |
| Mean | 7.8% | 5.9% |
| Median | 4.8% | 5.7% |
| Interquartile 25% (IQ1) | 3.5% | 4.1% |
| Interquartile 75% (IQ3) | 6.5% | 8.0% |
| Interquartile Range (IQR) | 2.9% | 3.9% |
| Standard Deviation (Sample) | 11.0% | 3.3% |
| Standard Deviation (Population) | 10.9% | 3.2% |
Demographics Similar to Immigrants from Ireland and Spanish Americans by Unemployment Among Ages 45 to 54 years
In terms of unemployment among ages 45 to 54 years, the demographic groups most similar to Immigrants from Ireland are Ottawa (4.7%, a difference of 0.010%), Japanese (4.7%, a difference of 0.040%), Immigrants (4.7%, a difference of 0.040%), Soviet Union (4.7%, a difference of 0.060%), and Immigrants from Israel (4.7%, a difference of 0.12%). Similarly, the demographic groups most similar to Spanish Americans are Yaqui (4.7%, a difference of 0.0%), Immigrants from Iraq (4.7%, a difference of 0.030%), Delaware (4.8%, a difference of 0.10%), Central American (4.8%, a difference of 0.10%), and Alsatian (4.7%, a difference of 0.17%).
| Demographics | Rating | Rank | Unemployment Among Ages 45 to 54 years |
| Immigrants | Norway | 4.8 /100 | #225 | Tragic 4.7% |
| Assyrians/Chaldeans/Syriacs | 3.5 /100 | #226 | Tragic 4.7% |
| Iraqis | 3.2 /100 | #227 | Tragic 4.7% |
| South American Indians | 3.1 /100 | #228 | Tragic 4.7% |
| Immigrants | Israel | 3.0 /100 | #229 | Tragic 4.7% |
| Japanese | 2.8 /100 | #230 | Tragic 4.7% |
| Immigrants | Ireland | 2.7 /100 | #231 | Tragic 4.7% |
| Ottawa | 2.7 /100 | #232 | Tragic 4.7% |
| Immigrants | Immigrants | 2.6 /100 | #233 | Tragic 4.7% |
| Soviet Union | 2.6 /100 | #234 | Tragic 4.7% |
| Cree | 2.3 /100 | #235 | Tragic 4.7% |
| Tlingit-Haida | 2.3 /100 | #236 | Tragic 4.7% |
| Alsatians | 1.6 /100 | #237 | Tragic 4.7% |
| Yaqui | 1.4 /100 | #238 | Tragic 4.7% |
| Spanish Americans | 1.4 /100 | #239 | Tragic 4.7% |
| Immigrants | Iraq | 1.3 /100 | #240 | Tragic 4.7% |
| Delaware | 1.3 /100 | #241 | Tragic 4.8% |
| Central Americans | 1.3 /100 | #242 | Tragic 4.8% |
| Portuguese | 1.1 /100 | #243 | Tragic 4.8% |
| Seminole | 1.1 /100 | #244 | Tragic 4.8% |
| Immigrants | Albania | 0.9 /100 | #245 | Tragic 4.8% |