Immigrants from Western Africa vs Nonimmigrants Unemployment Among Ages 35 to 44 years
COMPARE
Immigrants from Western Africa
Nonimmigrants
Unemployment Among Ages 35 to 44 years
Unemployment Among Ages 35 to 44 years Comparison
Immigrants from Western Africa
Nonimmigrants
5.3%
UNEMPLOYMENT AMONG AGES 35 TO 44 YEARS
0.0/ 100
METRIC RATING
267th/ 347
METRIC RANK
4.9%
UNEMPLOYMENT AMONG AGES 35 TO 44 YEARS
9.4/ 100
METRIC RATING
211th/ 347
METRIC RANK
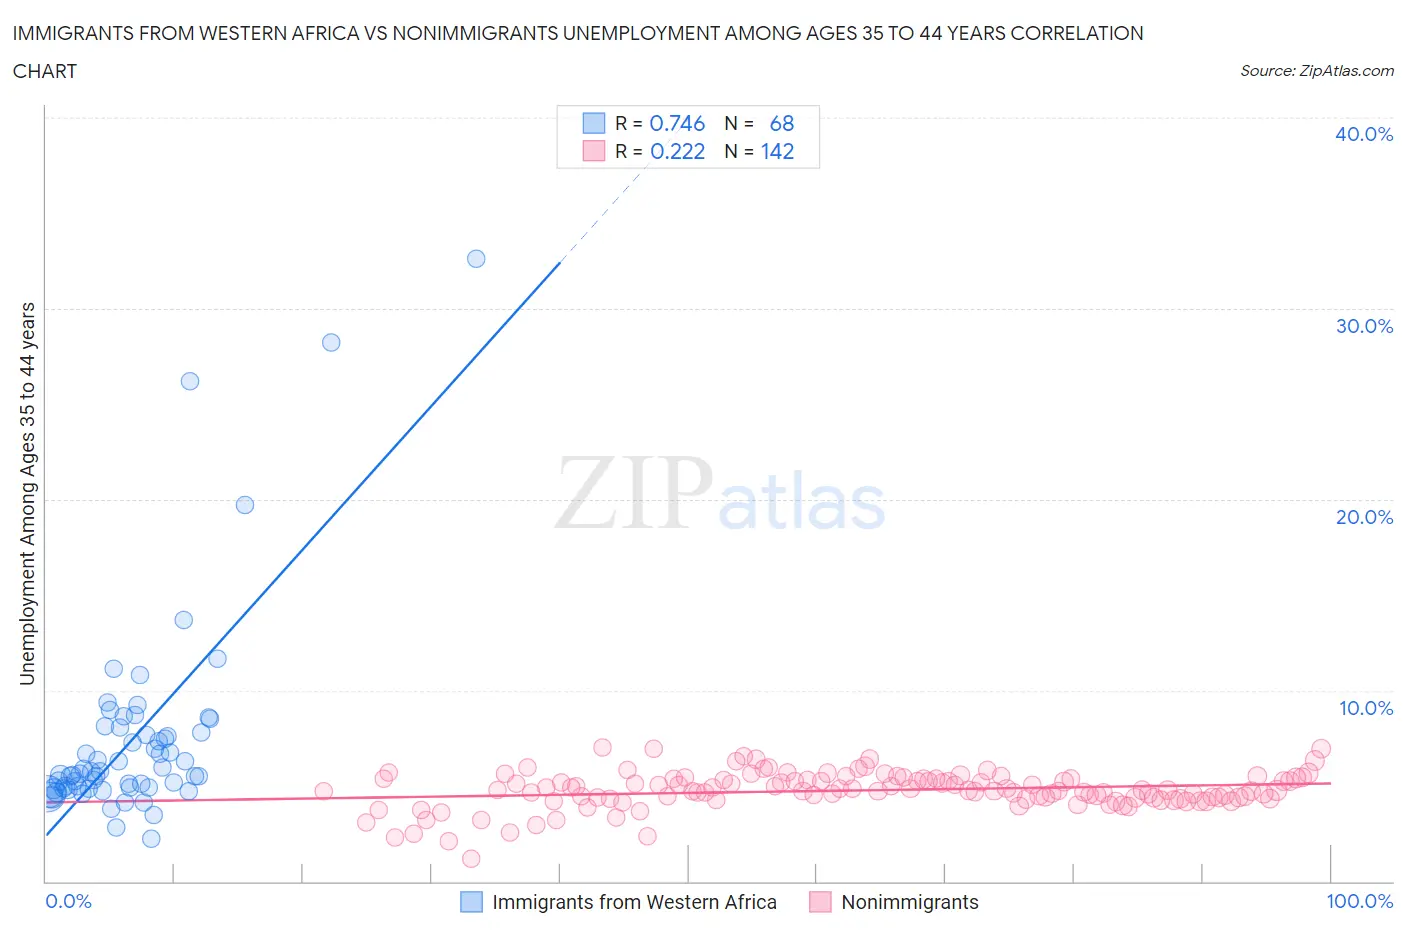
Immigrants from Western Africa vs Nonimmigrants Unemployment Among Ages 35 to 44 years Correlation Chart
The statistical analysis conducted on geographies consisting of 352,162,514 people shows a strong positive correlation between the proportion of Immigrants from Western Africa and unemployment rate among population between the ages 35 and 44 in the United States with a correlation coefficient (R) of 0.746 and weighted average of 5.3%. Similarly, the statistical analysis conducted on geographies consisting of 530,556,110 people shows a weak positive correlation between the proportion of Nonimmigrants and unemployment rate among population between the ages 35 and 44 in the United States with a correlation coefficient (R) of 0.222 and weighted average of 4.9%, a difference of 9.2%.
Unemployment Among Ages 35 to 44 years Correlation Summary
| Measurement | Immigrants from Western Africa | Nonimmigrants |
| Minimum | 2.2% | 1.2% |
| Maximum | 32.6% | 7.0% |
| Range | 30.4% | 5.8% |
| Mean | 7.5% | 4.8% |
| Median | 5.7% | 4.8% |
| Interquartile 25% (IQ1) | 4.9% | 4.4% |
| Interquartile 75% (IQ3) | 7.9% | 5.3% |
| Interquartile Range (IQR) | 3.1% | 0.99% |
| Standard Deviation (Sample) | 5.4% | 0.94% |
| Standard Deviation (Population) | 5.3% | 0.94% |
Similar Demographics by Unemployment Among Ages 35 to 44 years
Demographics Similar to Immigrants from Western Africa by Unemployment Among Ages 35 to 44 years
In terms of unemployment among ages 35 to 44 years, the demographic groups most similar to Immigrants from Western Africa are Hawaiian (5.3%, a difference of 0.080%), Cajun (5.3%, a difference of 0.090%), Immigrants from Bangladesh (5.3%, a difference of 0.13%), Yaqui (5.3%, a difference of 0.14%), and Blackfeet (5.3%, a difference of 0.23%).
| Demographics | Rating | Rank | Unemployment Among Ages 35 to 44 years |
| Sub-Saharan Africans | 0.1 /100 | #260 | Tragic 5.3% |
| Spanish Americans | 0.1 /100 | #261 | Tragic 5.3% |
| Immigrants | Central America | 0.1 /100 | #262 | Tragic 5.3% |
| Choctaw | 0.1 /100 | #263 | Tragic 5.3% |
| Ghanaians | 0.1 /100 | #264 | Tragic 5.3% |
| Yaqui | 0.1 /100 | #265 | Tragic 5.3% |
| Immigrants | Bangladesh | 0.1 /100 | #266 | Tragic 5.3% |
| Immigrants | Western Africa | 0.0 /100 | #267 | Tragic 5.3% |
| Hawaiians | 0.0 /100 | #268 | Tragic 5.3% |
| Cajuns | 0.0 /100 | #269 | Tragic 5.3% |
| Blackfeet | 0.0 /100 | #270 | Tragic 5.3% |
| Ute | 0.0 /100 | #271 | Tragic 5.3% |
| Senegalese | 0.0 /100 | #272 | Tragic 5.3% |
| Vietnamese | 0.0 /100 | #273 | Tragic 5.4% |
| Creek | 0.0 /100 | #274 | Tragic 5.4% |
Demographics Similar to Nonimmigrants by Unemployment Among Ages 35 to 44 years
In terms of unemployment among ages 35 to 44 years, the demographic groups most similar to Nonimmigrants are Fijian (4.9%, a difference of 0.16%), Osage (4.9%, a difference of 0.17%), Immigrants from Africa (4.9%, a difference of 0.26%), Immigrants (4.9%, a difference of 0.31%), and Immigrants from Cameroon (4.9%, a difference of 0.36%).
| Demographics | Rating | Rank | Unemployment Among Ages 35 to 44 years |
| Immigrants | Philippines | 19.8 /100 | #204 | Poor 4.8% |
| Spaniards | 18.7 /100 | #205 | Poor 4.8% |
| Soviet Union | 18.4 /100 | #206 | Poor 4.8% |
| Immigrants | Western Asia | 16.6 /100 | #207 | Poor 4.8% |
| French Canadians | 16.5 /100 | #208 | Poor 4.8% |
| Immigrants | Uruguay | 11.5 /100 | #209 | Poor 4.9% |
| Immigrants | Cameroon | 11.4 /100 | #210 | Poor 4.9% |
| Immigrants | Nonimmigrants | 9.4 /100 | #211 | Tragic 4.9% |
| Fijians | 8.7 /100 | #212 | Tragic 4.9% |
| Osage | 8.6 /100 | #213 | Tragic 4.9% |
| Immigrants | Africa | 8.2 /100 | #214 | Tragic 4.9% |
| Immigrants | Immigrants | 8.0 /100 | #215 | Tragic 4.9% |
| Americans | 6.2 /100 | #216 | Tragic 4.9% |
| Moroccans | 6.0 /100 | #217 | Tragic 4.9% |
| Chickasaw | 5.7 /100 | #218 | Tragic 4.9% |