Kiowa vs Soviet Union Unemployment Among Youth under 25 years
COMPARE
Kiowa
Soviet Union
Unemployment Among Youth under 25 years
Unemployment Among Youth under 25 years Comparison
Kiowa
Soviet Union
12.7%
UNEMPLOYMENT AMONG YOUTH UNDER 25 YEARS
0.0/ 100
METRIC RATING
269th/ 347
METRIC RANK
12.2%
UNEMPLOYMENT AMONG YOUTH UNDER 25 YEARS
0.6/ 100
METRIC RATING
249th/ 347
METRIC RANK
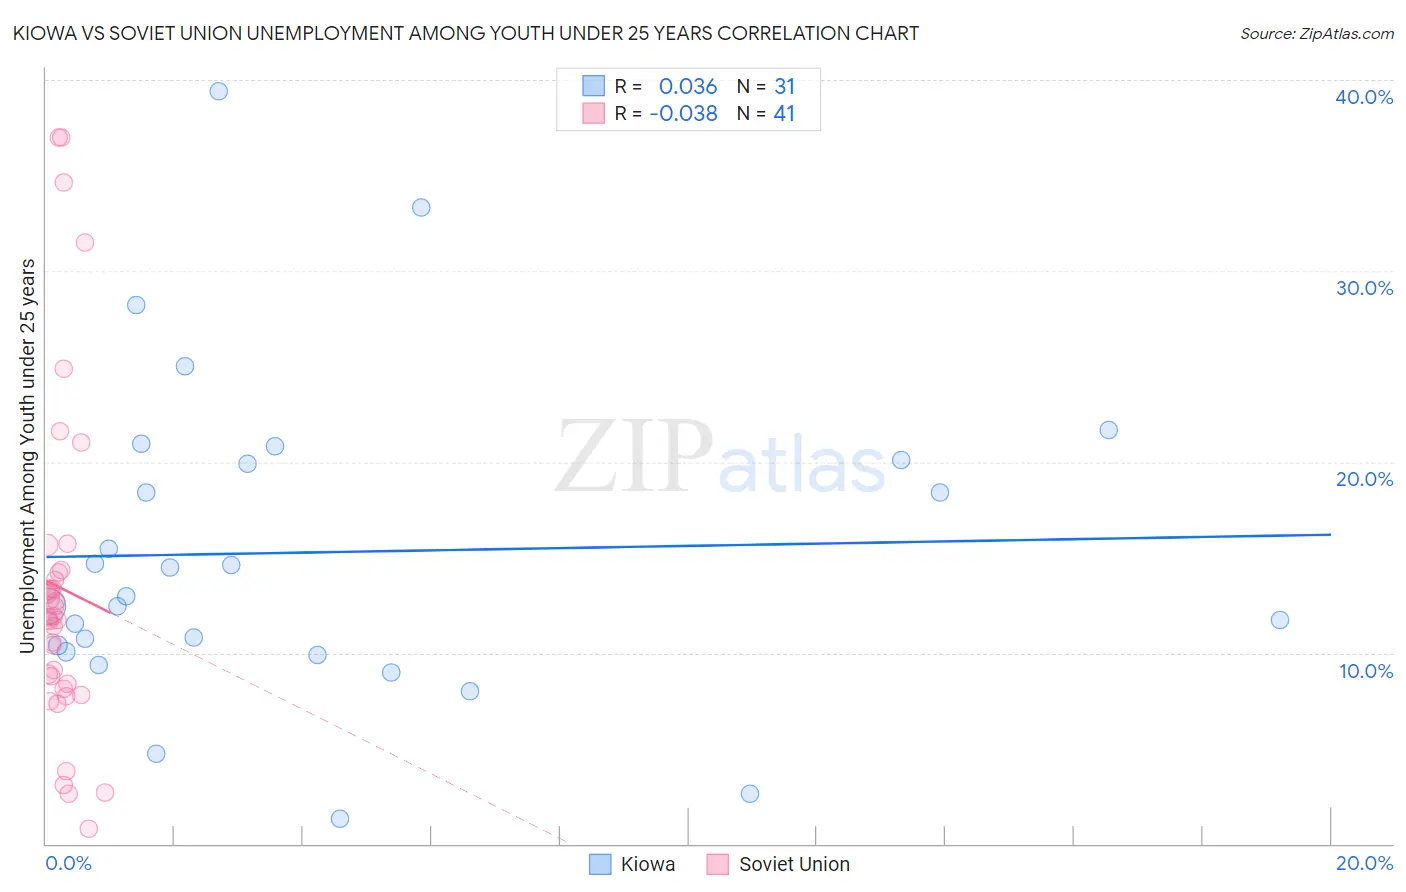
Kiowa vs Soviet Union Unemployment Among Youth under 25 years Correlation Chart
The statistical analysis conducted on geographies consisting of 55,922,493 people shows no correlation between the proportion of Kiowa and unemployment rate among youth under the age of 25 in the United States with a correlation coefficient (R) of 0.036 and weighted average of 12.7%. Similarly, the statistical analysis conducted on geographies consisting of 43,455,667 people shows no correlation between the proportion of Soviet Union and unemployment rate among youth under the age of 25 in the United States with a correlation coefficient (R) of -0.038 and weighted average of 12.2%, a difference of 3.7%.
Unemployment Among Youth under 25 years Correlation Summary
| Measurement | Kiowa | Soviet Union |
| Minimum | 1.3% | 0.80% |
| Maximum | 39.4% | 37.0% |
| Range | 38.1% | 36.2% |
| Mean | 15.3% | 13.4% |
| Median | 12.9% | 11.9% |
| Interquartile 25% (IQ1) | 10.1% | 8.3% |
| Interquartile 75% (IQ3) | 20.1% | 14.3% |
| Interquartile Range (IQR) | 10.0% | 6.0% |
| Standard Deviation (Sample) | 8.4% | 8.7% |
| Standard Deviation (Population) | 8.2% | 8.6% |
Demographics Similar to Kiowa and Soviet Union by Unemployment Among Youth under 25 years
In terms of unemployment among youth under 25 years, the demographic groups most similar to Kiowa are Tlingit-Haida (12.7%, a difference of 0.12%), Subsaharan African (12.6%, a difference of 0.20%), Immigrants from Latin America (12.6%, a difference of 0.34%), Nepalese (12.5%, a difference of 1.2%), and Puget Sound Salish (12.5%, a difference of 1.3%). Similarly, the demographic groups most similar to Soviet Union are Delaware (12.3%, a difference of 0.42%), Mexican American Indian (12.3%, a difference of 0.45%), Immigrants from Syria (12.3%, a difference of 0.49%), Mexican (12.3%, a difference of 0.53%), and Honduran (12.3%, a difference of 0.54%).
| Demographics | Rating | Rank | Unemployment Among Youth under 25 years |
| Soviet Union | 0.6 /100 | #249 | Tragic 12.2% |
| Delaware | 0.4 /100 | #250 | Tragic 12.3% |
| Mexican American Indians | 0.4 /100 | #251 | Tragic 12.3% |
| Immigrants | Syria | 0.3 /100 | #252 | Tragic 12.3% |
| Mexicans | 0.3 /100 | #253 | Tragic 12.3% |
| Hondurans | 0.3 /100 | #254 | Tragic 12.3% |
| Hispanics or Latinos | 0.2 /100 | #255 | Tragic 12.4% |
| Liberians | 0.2 /100 | #256 | Tragic 12.4% |
| Panamanians | 0.2 /100 | #257 | Tragic 12.4% |
| Salvadorans | 0.1 /100 | #258 | Tragic 12.4% |
| Immigrants | Central America | 0.1 /100 | #259 | Tragic 12.4% |
| Immigrants | Panama | 0.1 /100 | #260 | Tragic 12.4% |
| Immigrants | El Salvador | 0.1 /100 | #261 | Tragic 12.4% |
| Immigrants | Mexico | 0.1 /100 | #262 | Tragic 12.4% |
| Cree | 0.1 /100 | #263 | Tragic 12.4% |
| Puget Sound Salish | 0.1 /100 | #264 | Tragic 12.5% |
| Nepalese | 0.0 /100 | #265 | Tragic 12.5% |
| Immigrants | Latin America | 0.0 /100 | #266 | Tragic 12.6% |
| Sub-Saharan Africans | 0.0 /100 | #267 | Tragic 12.6% |
| Tlingit-Haida | 0.0 /100 | #268 | Tragic 12.7% |
| Kiowa | 0.0 /100 | #269 | Tragic 12.7% |