Kiowa vs Maltese Unemployment Among Youth under 25 years
COMPARE
Kiowa
Maltese
Unemployment Among Youth under 25 years
Unemployment Among Youth under 25 years Comparison
Kiowa
Maltese
12.7%
UNEMPLOYMENT AMONG YOUTH UNDER 25 YEARS
0.0/ 100
METRIC RATING
269th/ 347
METRIC RANK
11.7%
UNEMPLOYMENT AMONG YOUTH UNDER 25 YEARS
33.9/ 100
METRIC RATING
186th/ 347
METRIC RANK
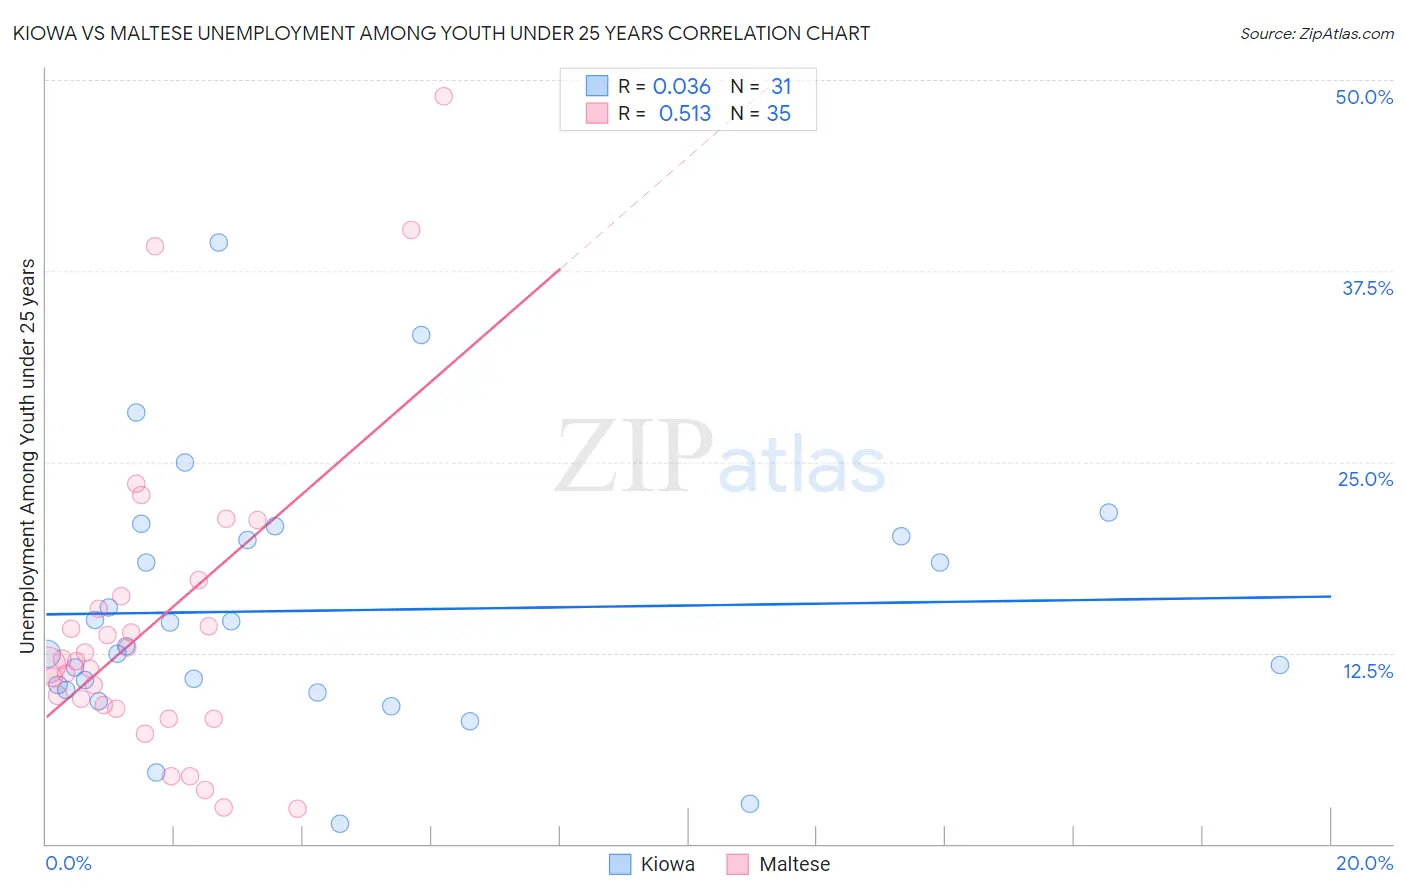
Kiowa vs Maltese Unemployment Among Youth under 25 years Correlation Chart
The statistical analysis conducted on geographies consisting of 55,922,493 people shows no correlation between the proportion of Kiowa and unemployment rate among youth under the age of 25 in the United States with a correlation coefficient (R) of 0.036 and weighted average of 12.7%. Similarly, the statistical analysis conducted on geographies consisting of 125,852,154 people shows a substantial positive correlation between the proportion of Maltese and unemployment rate among youth under the age of 25 in the United States with a correlation coefficient (R) of 0.513 and weighted average of 11.7%, a difference of 8.4%.
Unemployment Among Youth under 25 years Correlation Summary
| Measurement | Kiowa | Maltese |
| Minimum | 1.3% | 2.3% |
| Maximum | 39.4% | 48.9% |
| Range | 38.1% | 46.6% |
| Mean | 15.3% | 14.4% |
| Median | 12.9% | 12.0% |
| Interquartile 25% (IQ1) | 10.1% | 8.8% |
| Interquartile 75% (IQ3) | 20.1% | 16.2% |
| Interquartile Range (IQR) | 10.0% | 7.4% |
| Standard Deviation (Sample) | 8.4% | 10.4% |
| Standard Deviation (Population) | 8.2% | 10.2% |
Similar Demographics by Unemployment Among Youth under 25 years
Demographics Similar to Kiowa by Unemployment Among Youth under 25 years
In terms of unemployment among youth under 25 years, the demographic groups most similar to Kiowa are Tlingit-Haida (12.7%, a difference of 0.12%), Subsaharan African (12.6%, a difference of 0.20%), Immigrants from Latin America (12.6%, a difference of 0.34%), Immigrants from Liberia (12.8%, a difference of 1.1%), and Nepalese (12.5%, a difference of 1.2%).
| Demographics | Rating | Rank | Unemployment Among Youth under 25 years |
| Immigrants | Mexico | 0.1 /100 | #262 | Tragic 12.4% |
| Cree | 0.1 /100 | #263 | Tragic 12.4% |
| Puget Sound Salish | 0.1 /100 | #264 | Tragic 12.5% |
| Nepalese | 0.0 /100 | #265 | Tragic 12.5% |
| Immigrants | Latin America | 0.0 /100 | #266 | Tragic 12.6% |
| Sub-Saharan Africans | 0.0 /100 | #267 | Tragic 12.6% |
| Tlingit-Haida | 0.0 /100 | #268 | Tragic 12.7% |
| Kiowa | 0.0 /100 | #269 | Tragic 12.7% |
| Immigrants | Liberia | 0.0 /100 | #270 | Tragic 12.8% |
| Immigrants | Bahamas | 0.0 /100 | #271 | Tragic 12.9% |
| Cape Verdeans | 0.0 /100 | #272 | Tragic 12.9% |
| Nigerians | 0.0 /100 | #273 | Tragic 13.0% |
| Immigrants | Nigeria | 0.0 /100 | #274 | Tragic 13.0% |
| Bermudans | 0.0 /100 | #275 | Tragic 13.0% |
| Immigrants | Uzbekistan | 0.0 /100 | #276 | Tragic 13.1% |
Demographics Similar to Maltese by Unemployment Among Youth under 25 years
In terms of unemployment among youth under 25 years, the demographic groups most similar to Maltese are French American Indian (11.7%, a difference of 0.0%), Immigrants from Eastern Europe (11.7%, a difference of 0.010%), American (11.7%, a difference of 0.030%), Immigrants from Egypt (11.7%, a difference of 0.090%), and Immigrants from Italy (11.7%, a difference of 0.10%).
| Demographics | Rating | Rank | Unemployment Among Youth under 25 years |
| Immigrants | Hong Kong | 42.4 /100 | #179 | Average 11.6% |
| Spaniards | 39.8 /100 | #180 | Fair 11.7% |
| Syrians | 38.4 /100 | #181 | Fair 11.7% |
| Immigrants | Italy | 36.2 /100 | #182 | Fair 11.7% |
| Americans | 34.5 /100 | #183 | Fair 11.7% |
| Immigrants | Eastern Europe | 34.1 /100 | #184 | Fair 11.7% |
| French American Indians | 34.0 /100 | #185 | Fair 11.7% |
| Maltese | 33.9 /100 | #186 | Fair 11.7% |
| Immigrants | Egypt | 31.9 /100 | #187 | Fair 11.7% |
| Immigrants | Poland | 31.4 /100 | #188 | Fair 11.7% |
| Japanese | 30.8 /100 | #189 | Fair 11.7% |
| Portuguese | 30.3 /100 | #190 | Fair 11.7% |
| Cypriots | 28.5 /100 | #191 | Fair 11.7% |
| Immigrants | Russia | 28.5 /100 | #192 | Fair 11.7% |
| Seminole | 27.9 /100 | #193 | Fair 11.7% |