Immigrants from El Salvador vs Soviet Union Unemployment Among Youth under 25 years
COMPARE
Immigrants from El Salvador
Soviet Union
Unemployment Among Youth under 25 years
Unemployment Among Youth under 25 years Comparison
Immigrants from El Salvador
Soviet Union
12.4%
UNEMPLOYMENT AMONG YOUTH UNDER 25 YEARS
0.1/ 100
METRIC RATING
261st/ 347
METRIC RANK
12.2%
UNEMPLOYMENT AMONG YOUTH UNDER 25 YEARS
0.6/ 100
METRIC RATING
249th/ 347
METRIC RANK
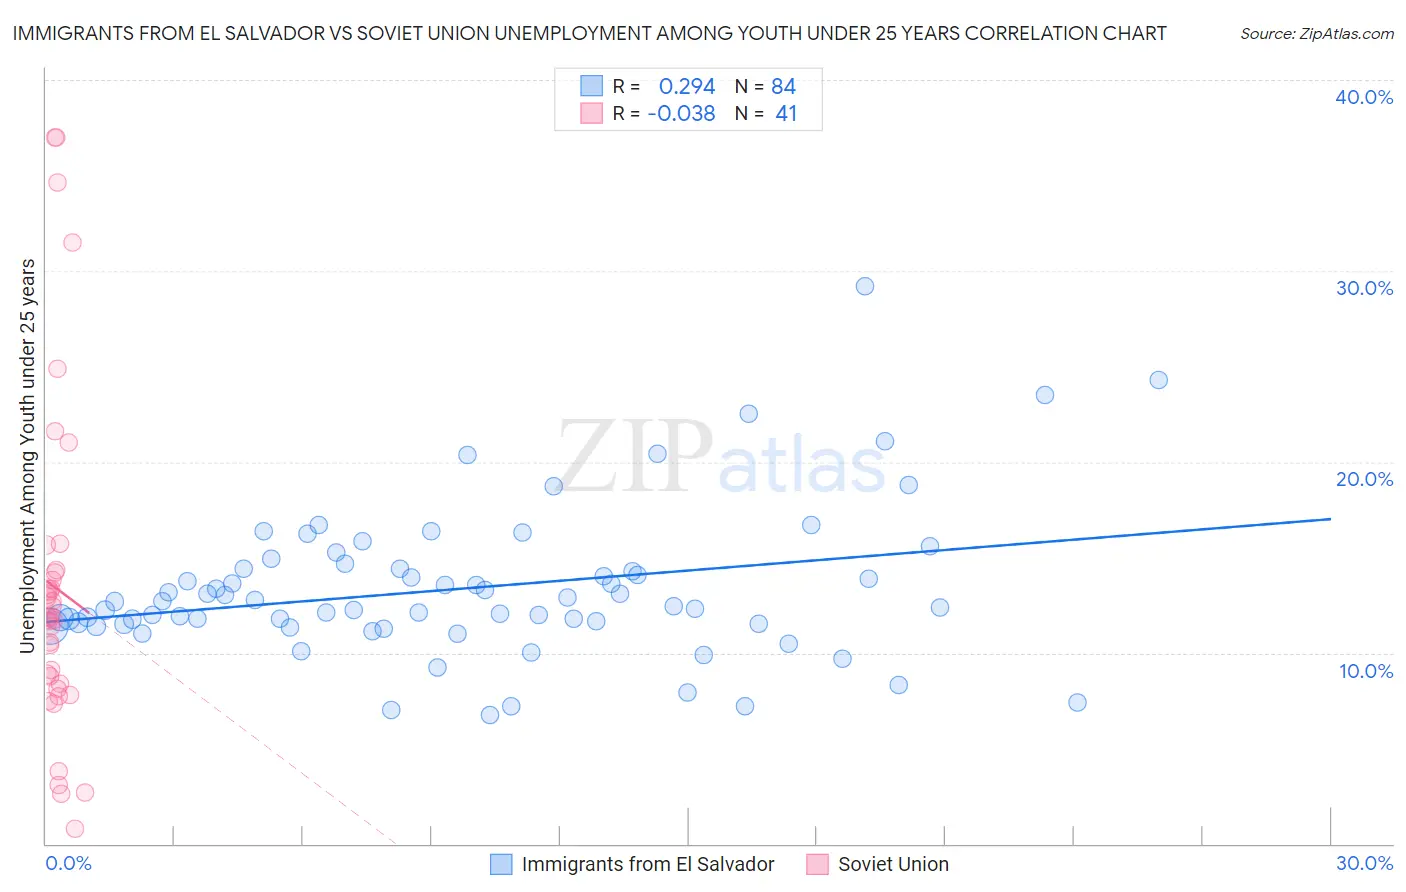
Immigrants from El Salvador vs Soviet Union Unemployment Among Youth under 25 years Correlation Chart
The statistical analysis conducted on geographies consisting of 354,363,061 people shows a weak positive correlation between the proportion of Immigrants from El Salvador and unemployment rate among youth under the age of 25 in the United States with a correlation coefficient (R) of 0.294 and weighted average of 12.4%. Similarly, the statistical analysis conducted on geographies consisting of 43,455,667 people shows no correlation between the proportion of Soviet Union and unemployment rate among youth under the age of 25 in the United States with a correlation coefficient (R) of -0.038 and weighted average of 12.2%, a difference of 1.7%.
Unemployment Among Youth under 25 years Correlation Summary
| Measurement | Immigrants from El Salvador | Soviet Union |
| Minimum | 6.7% | 0.80% |
| Maximum | 29.2% | 37.0% |
| Range | 22.4% | 36.2% |
| Mean | 13.4% | 13.4% |
| Median | 12.6% | 11.9% |
| Interquartile 25% (IQ1) | 11.5% | 8.3% |
| Interquartile 75% (IQ3) | 14.4% | 14.3% |
| Interquartile Range (IQR) | 2.9% | 6.0% |
| Standard Deviation (Sample) | 3.9% | 8.7% |
| Standard Deviation (Population) | 3.9% | 8.6% |
Demographics Similar to Immigrants from El Salvador and Soviet Union by Unemployment Among Youth under 25 years
In terms of unemployment among youth under 25 years, the demographic groups most similar to Immigrants from El Salvador are Immigrants from Panama (12.4%, a difference of 0.010%), Immigrants from Mexico (12.4%, a difference of 0.050%), Cree (12.4%, a difference of 0.14%), Immigrants from Central America (12.4%, a difference of 0.31%), and Salvadoran (12.4%, a difference of 0.37%). Similarly, the demographic groups most similar to Soviet Union are Central American (12.2%, a difference of 0.010%), Immigrants from Greece (12.2%, a difference of 0.020%), Immigrants from Honduras (12.2%, a difference of 0.13%), Spanish American (12.2%, a difference of 0.14%), and Delaware (12.3%, a difference of 0.42%).
| Demographics | Rating | Rank | Unemployment Among Youth under 25 years |
| Spanish Americans | 0.6 /100 | #245 | Tragic 12.2% |
| Immigrants | Honduras | 0.6 /100 | #246 | Tragic 12.2% |
| Immigrants | Greece | 0.6 /100 | #247 | Tragic 12.2% |
| Central Americans | 0.6 /100 | #248 | Tragic 12.2% |
| Soviet Union | 0.6 /100 | #249 | Tragic 12.2% |
| Delaware | 0.4 /100 | #250 | Tragic 12.3% |
| Mexican American Indians | 0.4 /100 | #251 | Tragic 12.3% |
| Immigrants | Syria | 0.3 /100 | #252 | Tragic 12.3% |
| Mexicans | 0.3 /100 | #253 | Tragic 12.3% |
| Hondurans | 0.3 /100 | #254 | Tragic 12.3% |
| Hispanics or Latinos | 0.2 /100 | #255 | Tragic 12.4% |
| Liberians | 0.2 /100 | #256 | Tragic 12.4% |
| Panamanians | 0.2 /100 | #257 | Tragic 12.4% |
| Salvadorans | 0.1 /100 | #258 | Tragic 12.4% |
| Immigrants | Central America | 0.1 /100 | #259 | Tragic 12.4% |
| Immigrants | Panama | 0.1 /100 | #260 | Tragic 12.4% |
| Immigrants | El Salvador | 0.1 /100 | #261 | Tragic 12.4% |
| Immigrants | Mexico | 0.1 /100 | #262 | Tragic 12.4% |
| Cree | 0.1 /100 | #263 | Tragic 12.4% |
| Puget Sound Salish | 0.1 /100 | #264 | Tragic 12.5% |
| Nepalese | 0.0 /100 | #265 | Tragic 12.5% |