Paiute vs Maltese Unemployment Among Youth under 25 years
COMPARE
Paiute
Maltese
Unemployment Among Youth under 25 years
Unemployment Among Youth under 25 years Comparison
Paiute
Maltese
17.6%
UNEMPLOYMENT AMONG YOUTH UNDER 25 YEARS
0.0/ 100
METRIC RATING
341st/ 347
METRIC RANK
11.7%
UNEMPLOYMENT AMONG YOUTH UNDER 25 YEARS
33.9/ 100
METRIC RATING
186th/ 347
METRIC RANK
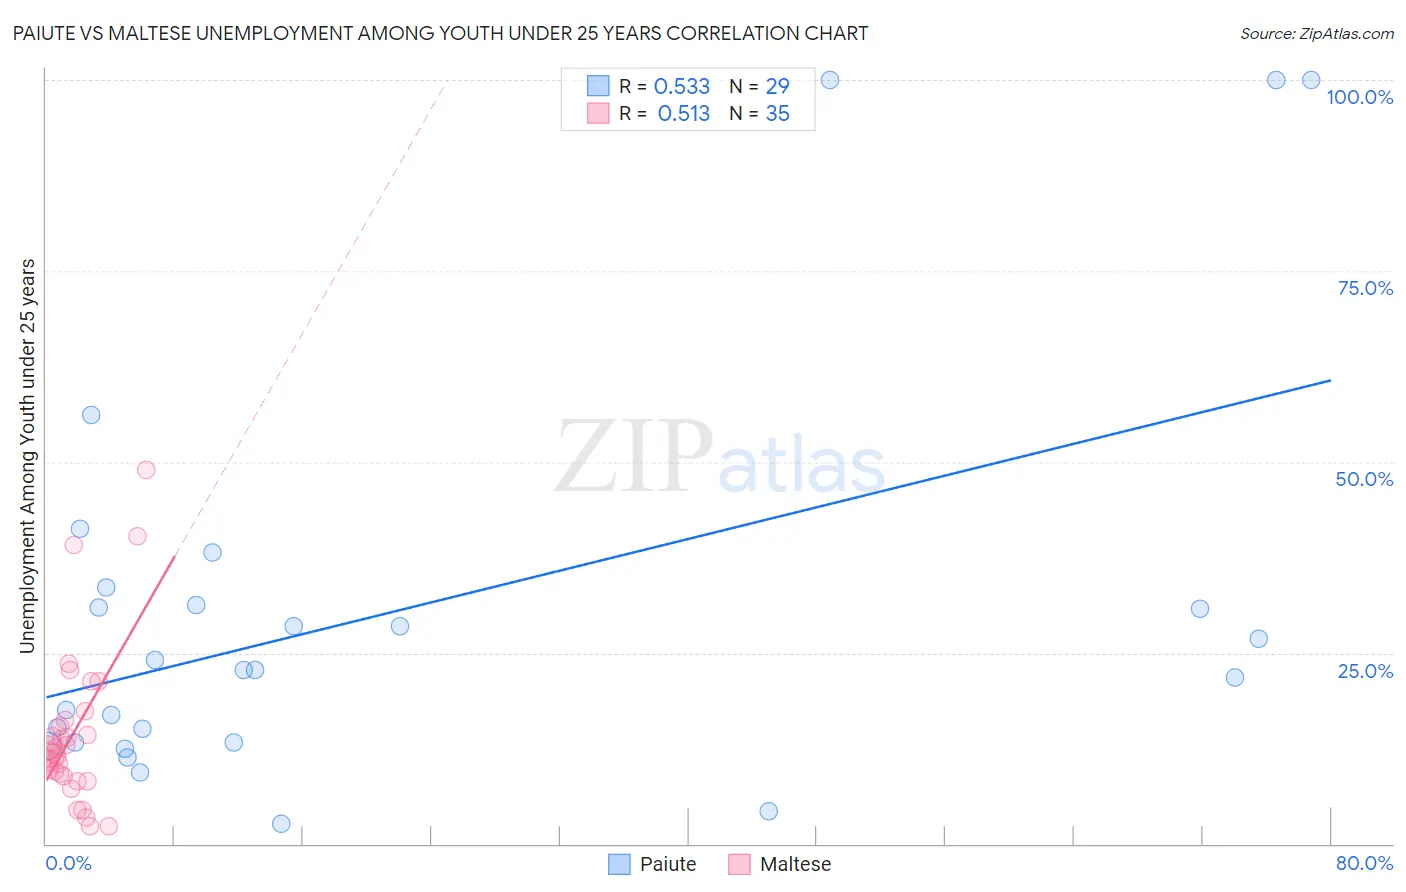
Paiute vs Maltese Unemployment Among Youth under 25 years Correlation Chart
The statistical analysis conducted on geographies consisting of 58,170,171 people shows a substantial positive correlation between the proportion of Paiute and unemployment rate among youth under the age of 25 in the United States with a correlation coefficient (R) of 0.533 and weighted average of 17.6%. Similarly, the statistical analysis conducted on geographies consisting of 125,852,154 people shows a substantial positive correlation between the proportion of Maltese and unemployment rate among youth under the age of 25 in the United States with a correlation coefficient (R) of 0.513 and weighted average of 11.7%, a difference of 50.3%.
Unemployment Among Youth under 25 years Correlation Summary
| Measurement | Paiute | Maltese |
| Minimum | 2.7% | 2.3% |
| Maximum | 100.0% | 48.9% |
| Range | 97.3% | 46.6% |
| Mean | 30.4% | 14.4% |
| Median | 22.8% | 12.0% |
| Interquartile 25% (IQ1) | 13.3% | 8.8% |
| Interquartile 75% (IQ3) | 32.4% | 16.2% |
| Interquartile Range (IQR) | 19.1% | 7.4% |
| Standard Deviation (Sample) | 26.7% | 10.4% |
| Standard Deviation (Population) | 26.2% | 10.2% |
Similar Demographics by Unemployment Among Youth under 25 years
Demographics Similar to Paiute by Unemployment Among Youth under 25 years
In terms of unemployment among youth under 25 years, the demographic groups most similar to Paiute are Colville (16.8%, a difference of 4.8%), Puerto Rican (18.4%, a difference of 4.8%), Navajo (18.6%, a difference of 6.0%), Tsimshian (16.5%, a difference of 6.5%), and Yuman (16.3%, a difference of 7.6%).
| Demographics | Rating | Rank | Unemployment Among Youth under 25 years |
| Guyanese | 0.0 /100 | #333 | Tragic 15.9% |
| Immigrants | Guyana | 0.0 /100 | #334 | Tragic 15.9% |
| Immigrants | St. Vincent and the Grenadines | 0.0 /100 | #335 | Tragic 16.1% |
| Pima | 0.0 /100 | #336 | Tragic 16.2% |
| Arapaho | 0.0 /100 | #337 | Tragic 16.3% |
| Yuman | 0.0 /100 | #338 | Tragic 16.3% |
| Tsimshian | 0.0 /100 | #339 | Tragic 16.5% |
| Colville | 0.0 /100 | #340 | Tragic 16.8% |
| Paiute | 0.0 /100 | #341 | Tragic 17.6% |
| Puerto Ricans | 0.0 /100 | #342 | Tragic 18.4% |
| Navajo | 0.0 /100 | #343 | Tragic 18.6% |
| Crow | 0.0 /100 | #344 | Tragic 20.1% |
| Hopi | 0.0 /100 | #345 | Tragic 21.5% |
| Inupiat | 0.0 /100 | #346 | Tragic 22.0% |
| Yup'ik | 0.0 /100 | #347 | Tragic 23.7% |
Demographics Similar to Maltese by Unemployment Among Youth under 25 years
In terms of unemployment among youth under 25 years, the demographic groups most similar to Maltese are French American Indian (11.7%, a difference of 0.0%), Immigrants from Eastern Europe (11.7%, a difference of 0.010%), American (11.7%, a difference of 0.030%), Immigrants from Egypt (11.7%, a difference of 0.090%), and Immigrants from Italy (11.7%, a difference of 0.10%).
| Demographics | Rating | Rank | Unemployment Among Youth under 25 years |
| Immigrants | Hong Kong | 42.4 /100 | #179 | Average 11.6% |
| Spaniards | 39.8 /100 | #180 | Fair 11.7% |
| Syrians | 38.4 /100 | #181 | Fair 11.7% |
| Immigrants | Italy | 36.2 /100 | #182 | Fair 11.7% |
| Americans | 34.5 /100 | #183 | Fair 11.7% |
| Immigrants | Eastern Europe | 34.1 /100 | #184 | Fair 11.7% |
| French American Indians | 34.0 /100 | #185 | Fair 11.7% |
| Maltese | 33.9 /100 | #186 | Fair 11.7% |
| Immigrants | Egypt | 31.9 /100 | #187 | Fair 11.7% |
| Immigrants | Poland | 31.4 /100 | #188 | Fair 11.7% |
| Japanese | 30.8 /100 | #189 | Fair 11.7% |
| Portuguese | 30.3 /100 | #190 | Fair 11.7% |
| Cypriots | 28.5 /100 | #191 | Fair 11.7% |
| Immigrants | Russia | 28.5 /100 | #192 | Fair 11.7% |
| Seminole | 27.9 /100 | #193 | Fair 11.7% |