Iroquois vs Immigrants from Spain Unemployment Among Ages 60 to 64 years
COMPARE
Iroquois
Immigrants from Spain
Unemployment Among Ages 60 to 64 years
Unemployment Among Ages 60 to 64 years Comparison
Iroquois
Immigrants from Spain
4.7%
UNEMPLOYMENT AMONG AGES 60 TO 64 YEARS
99.1/ 100
METRIC RATING
81st/ 347
METRIC RANK
5.2%
UNEMPLOYMENT AMONG AGES 60 TO 64 YEARS
0.1/ 100
METRIC RATING
273rd/ 347
METRIC RANK
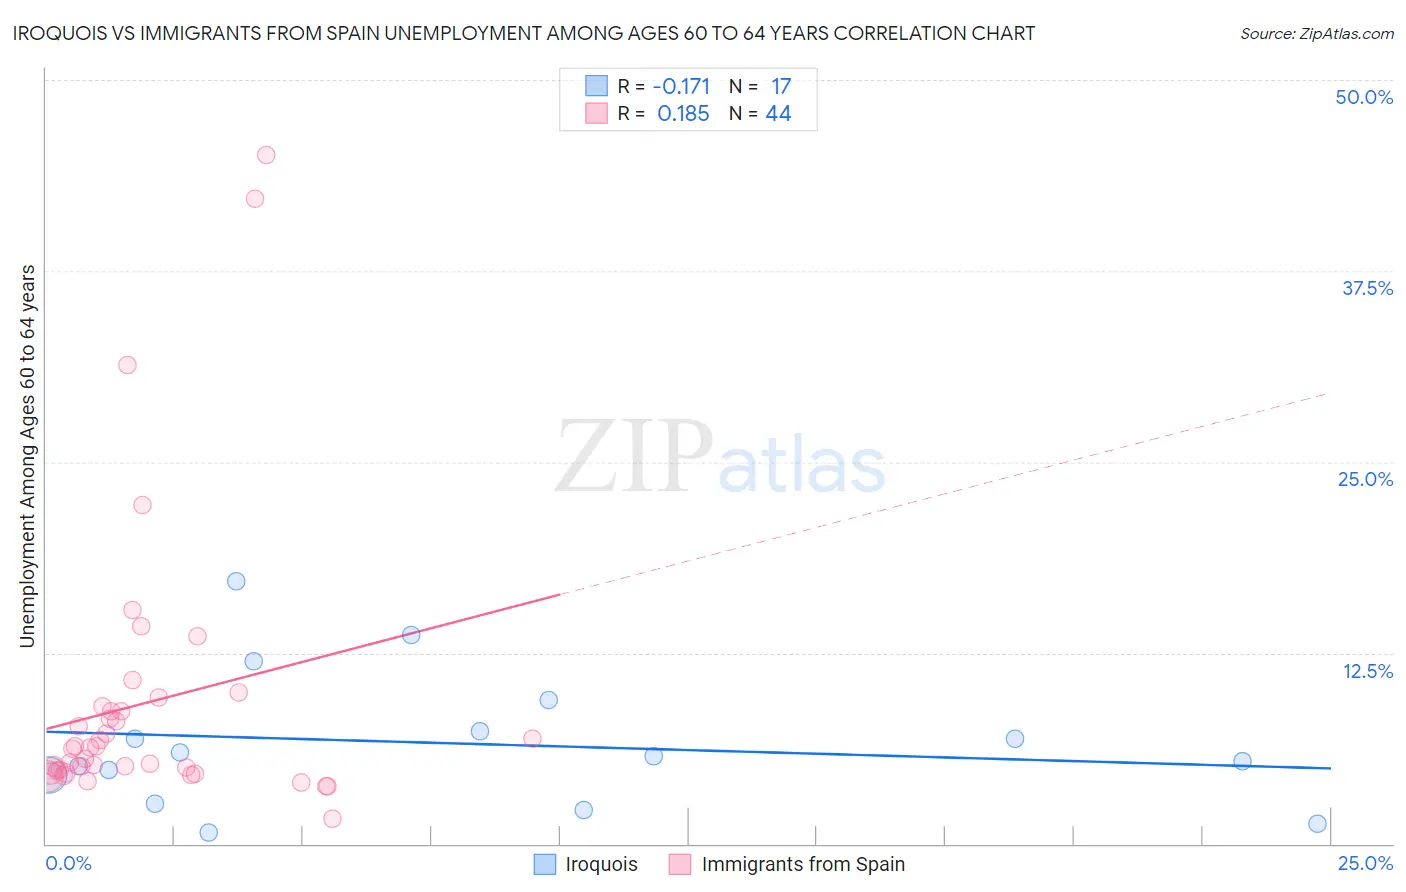
Iroquois vs Immigrants from Spain Unemployment Among Ages 60 to 64 years Correlation Chart
The statistical analysis conducted on geographies consisting of 192,997,204 people shows a poor negative correlation between the proportion of Iroquois and unemployment rate among population between the ages 60 and 64 in the United States with a correlation coefficient (R) of -0.171 and weighted average of 4.7%. Similarly, the statistical analysis conducted on geographies consisting of 226,488,675 people shows a poor positive correlation between the proportion of Immigrants from Spain and unemployment rate among population between the ages 60 and 64 in the United States with a correlation coefficient (R) of 0.185 and weighted average of 5.2%, a difference of 11.1%.
Unemployment Among Ages 60 to 64 years Correlation Summary
| Measurement | Iroquois | Immigrants from Spain |
| Minimum | 0.76% | 1.6% |
| Maximum | 17.1% | 45.1% |
| Range | 16.4% | 43.5% |
| Mean | 6.6% | 9.2% |
| Median | 5.7% | 6.3% |
| Interquartile 25% (IQ1) | 3.6% | 4.7% |
| Interquartile 75% (IQ3) | 8.4% | 8.9% |
| Interquartile Range (IQR) | 4.8% | 4.2% |
| Standard Deviation (Sample) | 4.4% | 9.2% |
| Standard Deviation (Population) | 4.3% | 9.1% |
Similar Demographics by Unemployment Among Ages 60 to 64 years
Demographics Similar to Iroquois by Unemployment Among Ages 60 to 64 years
In terms of unemployment among ages 60 to 64 years, the demographic groups most similar to Iroquois are Okinawan (4.7%, a difference of 0.0%), Icelander (4.7%, a difference of 0.010%), Immigrants from Egypt (4.7%, a difference of 0.010%), Irish (4.7%, a difference of 0.040%), and Seminole (4.7%, a difference of 0.070%).
| Demographics | Rating | Rank | Unemployment Among Ages 60 to 64 years |
| Northern Europeans | 99.3 /100 | #74 | Exceptional 4.6% |
| Potawatomi | 99.3 /100 | #75 | Exceptional 4.6% |
| Slovaks | 99.3 /100 | #76 | Exceptional 4.6% |
| Immigrants | Somalia | 99.2 /100 | #77 | Exceptional 4.6% |
| Seminole | 99.2 /100 | #78 | Exceptional 4.7% |
| Irish | 99.2 /100 | #79 | Exceptional 4.7% |
| Icelanders | 99.1 /100 | #80 | Exceptional 4.7% |
| Iroquois | 99.1 /100 | #81 | Exceptional 4.7% |
| Okinawans | 99.1 /100 | #82 | Exceptional 4.7% |
| Immigrants | Egypt | 99.1 /100 | #83 | Exceptional 4.7% |
| Thais | 98.9 /100 | #84 | Exceptional 4.7% |
| Immigrants | Sri Lanka | 98.9 /100 | #85 | Exceptional 4.7% |
| Immigrants | Oceania | 98.9 /100 | #86 | Exceptional 4.7% |
| Immigrants | Jordan | 98.8 /100 | #87 | Exceptional 4.7% |
| Immigrants | Bulgaria | 98.7 /100 | #88 | Exceptional 4.7% |
Demographics Similar to Immigrants from Spain by Unemployment Among Ages 60 to 64 years
In terms of unemployment among ages 60 to 64 years, the demographic groups most similar to Immigrants from Spain are Haitian (5.2%, a difference of 0.070%), Israeli (5.2%, a difference of 0.10%), Hopi (5.2%, a difference of 0.14%), Immigrants from Hong Kong (5.2%, a difference of 0.28%), and Immigrants from Iran (5.1%, a difference of 0.37%).
| Demographics | Rating | Rank | Unemployment Among Ages 60 to 64 years |
| Immigrants | Australia | 0.2 /100 | #266 | Tragic 5.1% |
| Immigrants | Bahamas | 0.2 /100 | #267 | Tragic 5.1% |
| Central American Indians | 0.2 /100 | #268 | Tragic 5.1% |
| Immigrants | Costa Rica | 0.2 /100 | #269 | Tragic 5.1% |
| Immigrants | Iran | 0.1 /100 | #270 | Tragic 5.1% |
| Israelis | 0.1 /100 | #271 | Tragic 5.2% |
| Haitians | 0.1 /100 | #272 | Tragic 5.2% |
| Immigrants | Spain | 0.1 /100 | #273 | Tragic 5.2% |
| Hopi | 0.1 /100 | #274 | Tragic 5.2% |
| Immigrants | Hong Kong | 0.1 /100 | #275 | Tragic 5.2% |
| Central Americans | 0.0 /100 | #276 | Tragic 5.2% |
| Immigrants | Caribbean | 0.0 /100 | #277 | Tragic 5.2% |
| Guatemalans | 0.0 /100 | #278 | Tragic 5.2% |
| Nepalese | 0.0 /100 | #279 | Tragic 5.2% |
| French American Indians | 0.0 /100 | #280 | Tragic 5.2% |