Immigrants from South America vs Immigrants from Pakistan Unemployment Among Ages 35 to 44 years
COMPARE
Immigrants from South America
Immigrants from Pakistan
Unemployment Among Ages 35 to 44 years
Unemployment Among Ages 35 to 44 years Comparison
Immigrants from South America
Immigrants from Pakistan
4.7%
UNEMPLOYMENT AMONG AGES 35 TO 44 YEARS
33.8/ 100
METRIC RATING
191st/ 347
METRIC RANK
4.3%
UNEMPLOYMENT AMONG AGES 35 TO 44 YEARS
99.2/ 100
METRIC RATING
30th/ 347
METRIC RANK
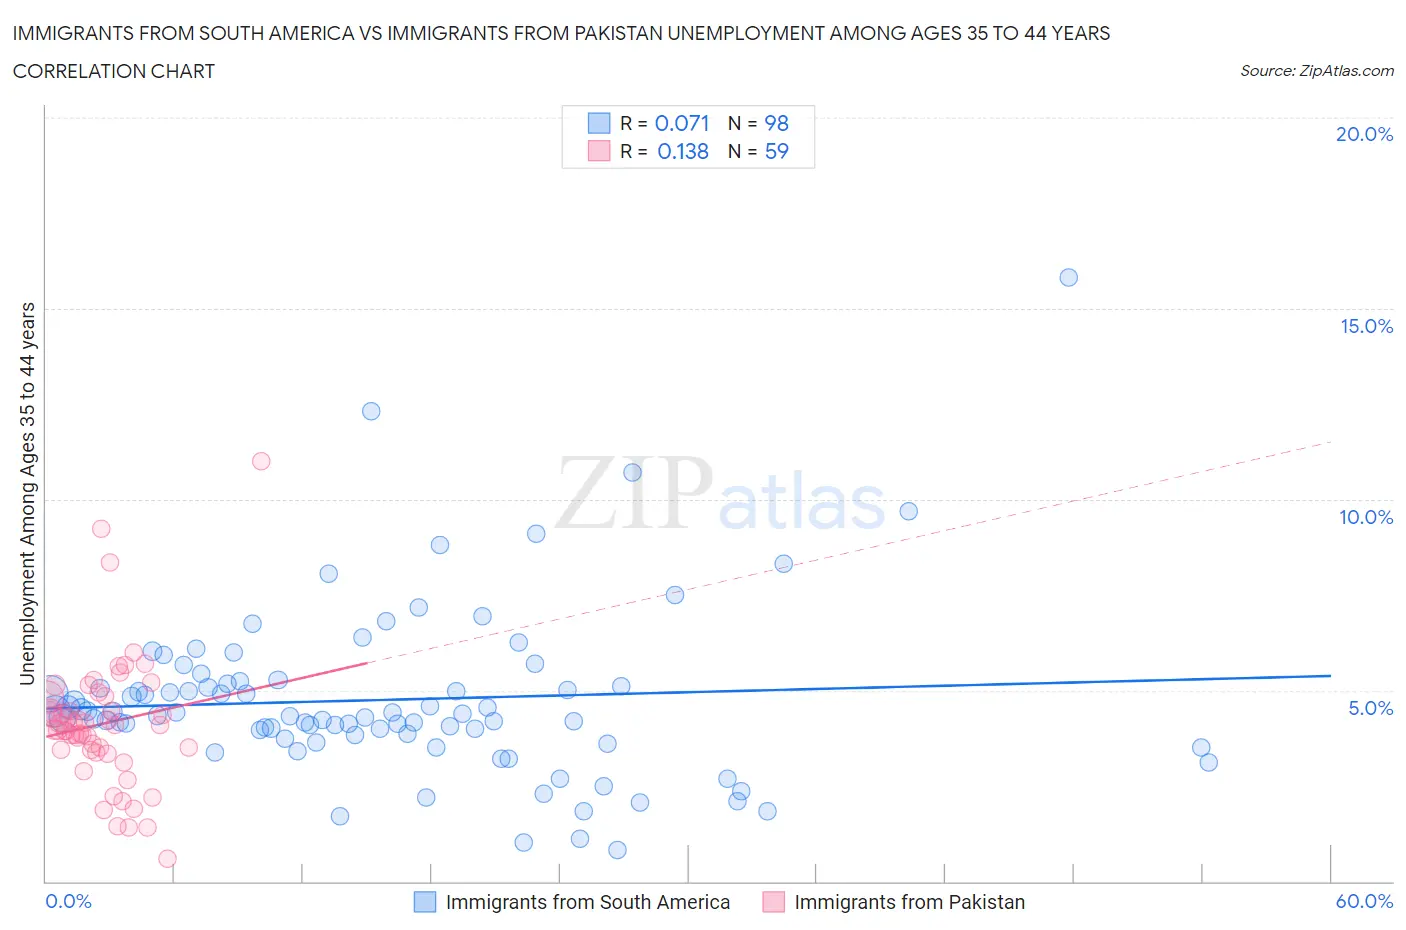
Immigrants from South America vs Immigrants from Pakistan Unemployment Among Ages 35 to 44 years Correlation Chart
The statistical analysis conducted on geographies consisting of 469,574,941 people shows a slight positive correlation between the proportion of Immigrants from South America and unemployment rate among population between the ages 35 and 44 in the United States with a correlation coefficient (R) of 0.071 and weighted average of 4.7%. Similarly, the statistical analysis conducted on geographies consisting of 280,835,646 people shows a poor positive correlation between the proportion of Immigrants from Pakistan and unemployment rate among population between the ages 35 and 44 in the United States with a correlation coefficient (R) of 0.138 and weighted average of 4.3%, a difference of 10.6%.
Unemployment Among Ages 35 to 44 years Correlation Summary
| Measurement | Immigrants from South America | Immigrants from Pakistan |
| Minimum | 0.83% | 0.60% |
| Maximum | 15.8% | 11.0% |
| Range | 15.0% | 10.4% |
| Mean | 4.8% | 4.1% |
| Median | 4.4% | 4.1% |
| Interquartile 25% (IQ1) | 3.8% | 3.4% |
| Interquartile 75% (IQ3) | 5.2% | 4.8% |
| Interquartile Range (IQR) | 1.3% | 1.4% |
| Standard Deviation (Sample) | 2.2% | 1.7% |
| Standard Deviation (Population) | 2.2% | 1.7% |
Similar Demographics by Unemployment Among Ages 35 to 44 years
Demographics Similar to Immigrants from South America by Unemployment Among Ages 35 to 44 years
In terms of unemployment among ages 35 to 44 years, the demographic groups most similar to Immigrants from South America are Immigrants from Southern Europe (4.7%, a difference of 0.0%), Immigrants from Congo (4.7%, a difference of 0.010%), Immigrants from Laos (4.7%, a difference of 0.050%), Malaysian (4.7%, a difference of 0.14%), and Cypriot (4.7%, a difference of 0.21%).
| Demographics | Rating | Rank | Unemployment Among Ages 35 to 44 years |
| Immigrants | Zaire | 37.3 /100 | #184 | Fair 4.7% |
| Immigrants | Costa Rica | 37.0 /100 | #185 | Fair 4.7% |
| Cypriots | 36.5 /100 | #186 | Fair 4.7% |
| Malaysians | 35.5 /100 | #187 | Fair 4.7% |
| Immigrants | Laos | 34.5 /100 | #188 | Fair 4.7% |
| Immigrants | Congo | 33.9 /100 | #189 | Fair 4.7% |
| Immigrants | Southern Europe | 33.8 /100 | #190 | Fair 4.7% |
| Immigrants | South America | 33.8 /100 | #191 | Fair 4.7% |
| Immigrants | Albania | 30.5 /100 | #192 | Fair 4.8% |
| Spanish | 30.4 /100 | #193 | Fair 4.8% |
| Koreans | 28.1 /100 | #194 | Fair 4.8% |
| Bangladeshis | 28.0 /100 | #195 | Fair 4.8% |
| Immigrants | Syria | 23.6 /100 | #196 | Fair 4.8% |
| Immigrants | Oceania | 23.2 /100 | #197 | Fair 4.8% |
| Immigrants | Thailand | 22.9 /100 | #198 | Fair 4.8% |
Demographics Similar to Immigrants from Pakistan by Unemployment Among Ages 35 to 44 years
In terms of unemployment among ages 35 to 44 years, the demographic groups most similar to Immigrants from Pakistan are Carpatho Rusyn (4.3%, a difference of 0.040%), European (4.3%, a difference of 0.070%), Chinese (4.3%, a difference of 0.14%), Immigrants from Sri Lanka (4.3%, a difference of 0.24%), and Immigrants from Japan (4.3%, a difference of 0.26%).
| Demographics | Rating | Rank | Unemployment Among Ages 35 to 44 years |
| Immigrants | Kuwait | 99.5 /100 | #23 | Exceptional 4.3% |
| Tlingit-Haida | 99.5 /100 | #24 | Exceptional 4.3% |
| Bulgarians | 99.3 /100 | #25 | Exceptional 4.3% |
| Turks | 99.3 /100 | #26 | Exceptional 4.3% |
| Assyrians/Chaldeans/Syriacs | 99.3 /100 | #27 | Exceptional 4.3% |
| Immigrants | Japan | 99.3 /100 | #28 | Exceptional 4.3% |
| Europeans | 99.2 /100 | #29 | Exceptional 4.3% |
| Immigrants | Pakistan | 99.2 /100 | #30 | Exceptional 4.3% |
| Carpatho Rusyns | 99.2 /100 | #31 | Exceptional 4.3% |
| Chinese | 99.1 /100 | #32 | Exceptional 4.3% |
| Immigrants | Sri Lanka | 99.1 /100 | #33 | Exceptional 4.3% |
| Jordanians | 99.0 /100 | #34 | Exceptional 4.3% |
| Luxembourgers | 99.0 /100 | #35 | Exceptional 4.3% |
| Mongolians | 98.9 /100 | #36 | Exceptional 4.3% |
| Immigrants | Zimbabwe | 98.9 /100 | #37 | Exceptional 4.3% |