Sri Lankan vs Portuguese Unemployment Among Ages 60 to 64 years
COMPARE
Sri Lankan
Portuguese
Unemployment Among Ages 60 to 64 years
Unemployment Among Ages 60 to 64 years Comparison
Sri Lankans
Portuguese
4.9%
UNEMPLOYMENT AMONG AGES 60 TO 64 YEARS
39.8/ 100
METRIC RATING
182nd/ 347
METRIC RANK
4.7%
UNEMPLOYMENT AMONG AGES 60 TO 64 YEARS
97.9/ 100
METRIC RATING
100th/ 347
METRIC RANK
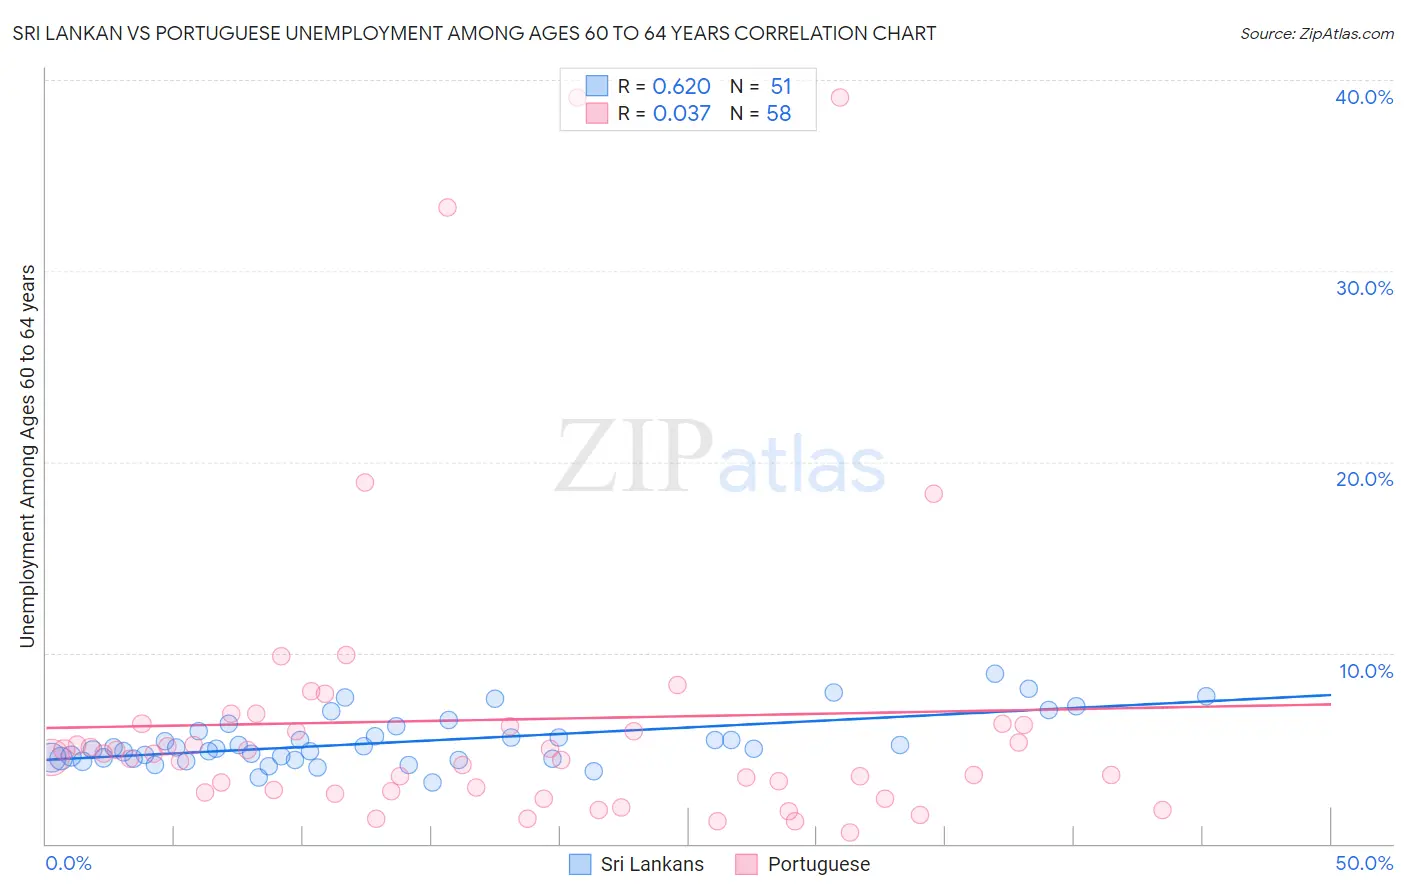
Sri Lankan vs Portuguese Unemployment Among Ages 60 to 64 years Correlation Chart
The statistical analysis conducted on geographies consisting of 393,788,798 people shows a significant positive correlation between the proportion of Sri Lankans and unemployment rate among population between the ages 60 and 64 in the United States with a correlation coefficient (R) of 0.620 and weighted average of 4.9%. Similarly, the statistical analysis conducted on geographies consisting of 398,687,122 people shows no correlation between the proportion of Portuguese and unemployment rate among population between the ages 60 and 64 in the United States with a correlation coefficient (R) of 0.037 and weighted average of 4.7%, a difference of 3.9%.
Unemployment Among Ages 60 to 64 years Correlation Summary
| Measurement | Sri Lankan | Portuguese |
| Minimum | 3.2% | 0.60% |
| Maximum | 8.9% | 39.1% |
| Range | 5.7% | 38.5% |
| Mean | 5.3% | 6.5% |
| Median | 5.0% | 4.6% |
| Interquartile 25% (IQ1) | 4.5% | 2.8% |
| Interquartile 75% (IQ3) | 5.9% | 6.2% |
| Interquartile Range (IQR) | 1.4% | 3.4% |
| Standard Deviation (Sample) | 1.3% | 8.0% |
| Standard Deviation (Population) | 1.3% | 7.9% |
Similar Demographics by Unemployment Among Ages 60 to 64 years
Demographics Similar to Sri Lankans by Unemployment Among Ages 60 to 64 years
In terms of unemployment among ages 60 to 64 years, the demographic groups most similar to Sri Lankans are Hungarian (4.9%, a difference of 0.030%), Subsaharan African (4.9%, a difference of 0.030%), Asian (4.9%, a difference of 0.040%), Immigrants from Ukraine (4.9%, a difference of 0.080%), and Ute (4.9%, a difference of 0.090%).
| Demographics | Rating | Rank | Unemployment Among Ages 60 to 64 years |
| Immigrants | Latvia | 46.9 /100 | #175 | Average 4.9% |
| Bermudans | 46.5 /100 | #176 | Average 4.9% |
| Immigrants | Malaysia | 44.7 /100 | #177 | Average 4.9% |
| Immigrants | Nonimmigrants | 44.5 /100 | #178 | Average 4.9% |
| Immigrants | Sweden | 44.3 /100 | #179 | Average 4.9% |
| Asians | 40.8 /100 | #180 | Average 4.9% |
| Hungarians | 40.6 /100 | #181 | Average 4.9% |
| Sri Lankans | 39.8 /100 | #182 | Fair 4.9% |
| Sub-Saharan Africans | 38.9 /100 | #183 | Fair 4.9% |
| Immigrants | Ukraine | 37.6 /100 | #184 | Fair 4.9% |
| Ute | 37.4 /100 | #185 | Fair 4.9% |
| Spaniards | 35.8 /100 | #186 | Fair 4.9% |
| South American Indians | 31.2 /100 | #187 | Fair 4.9% |
| Nicaraguans | 30.4 /100 | #188 | Fair 4.9% |
| Immigrants | Nicaragua | 29.8 /100 | #189 | Fair 4.9% |
Demographics Similar to Portuguese by Unemployment Among Ages 60 to 64 years
In terms of unemployment among ages 60 to 64 years, the demographic groups most similar to Portuguese are Malaysian (4.7%, a difference of 0.0%), Immigrants from Canada (4.7%, a difference of 0.020%), Egyptian (4.7%, a difference of 0.030%), White/Caucasian (4.7%, a difference of 0.030%), and Immigrants from Albania (4.7%, a difference of 0.040%).
| Demographics | Rating | Rank | Unemployment Among Ages 60 to 64 years |
| Immigrants | Saudi Arabia | 98.3 /100 | #93 | Exceptional 4.7% |
| Immigrants | Kuwait | 98.3 /100 | #94 | Exceptional 4.7% |
| Serbians | 98.2 /100 | #95 | Exceptional 4.7% |
| Poles | 98.1 /100 | #96 | Exceptional 4.7% |
| Immigrants | Albania | 98.0 /100 | #97 | Exceptional 4.7% |
| Somalis | 98.0 /100 | #98 | Exceptional 4.7% |
| Egyptians | 98.0 /100 | #99 | Exceptional 4.7% |
| Portuguese | 97.9 /100 | #100 | Exceptional 4.7% |
| Malaysians | 97.9 /100 | #101 | Exceptional 4.7% |
| Immigrants | Canada | 97.8 /100 | #102 | Exceptional 4.7% |
| Whites/Caucasians | 97.8 /100 | #103 | Exceptional 4.7% |
| Paraguayans | 97.7 /100 | #104 | Exceptional 4.7% |
| Canadians | 97.7 /100 | #105 | Exceptional 4.7% |
| Immigrants | North America | 97.6 /100 | #106 | Exceptional 4.7% |
| Greeks | 97.5 /100 | #107 | Exceptional 4.7% |