Italian vs Immigrants from Afghanistan Unemployment Among Youth under 25 years
COMPARE
Italian
Immigrants from Afghanistan
Unemployment Among Youth under 25 years
Unemployment Among Youth under 25 years Comparison
Italians
Immigrants from Afghanistan
11.4%
UNEMPLOYMENT AMONG YOUTH UNDER 25 YEARS
87.2/ 100
METRIC RATING
124th/ 347
METRIC RANK
11.3%
UNEMPLOYMENT AMONG YOUTH UNDER 25 YEARS
93.4/ 100
METRIC RATING
104th/ 347
METRIC RANK
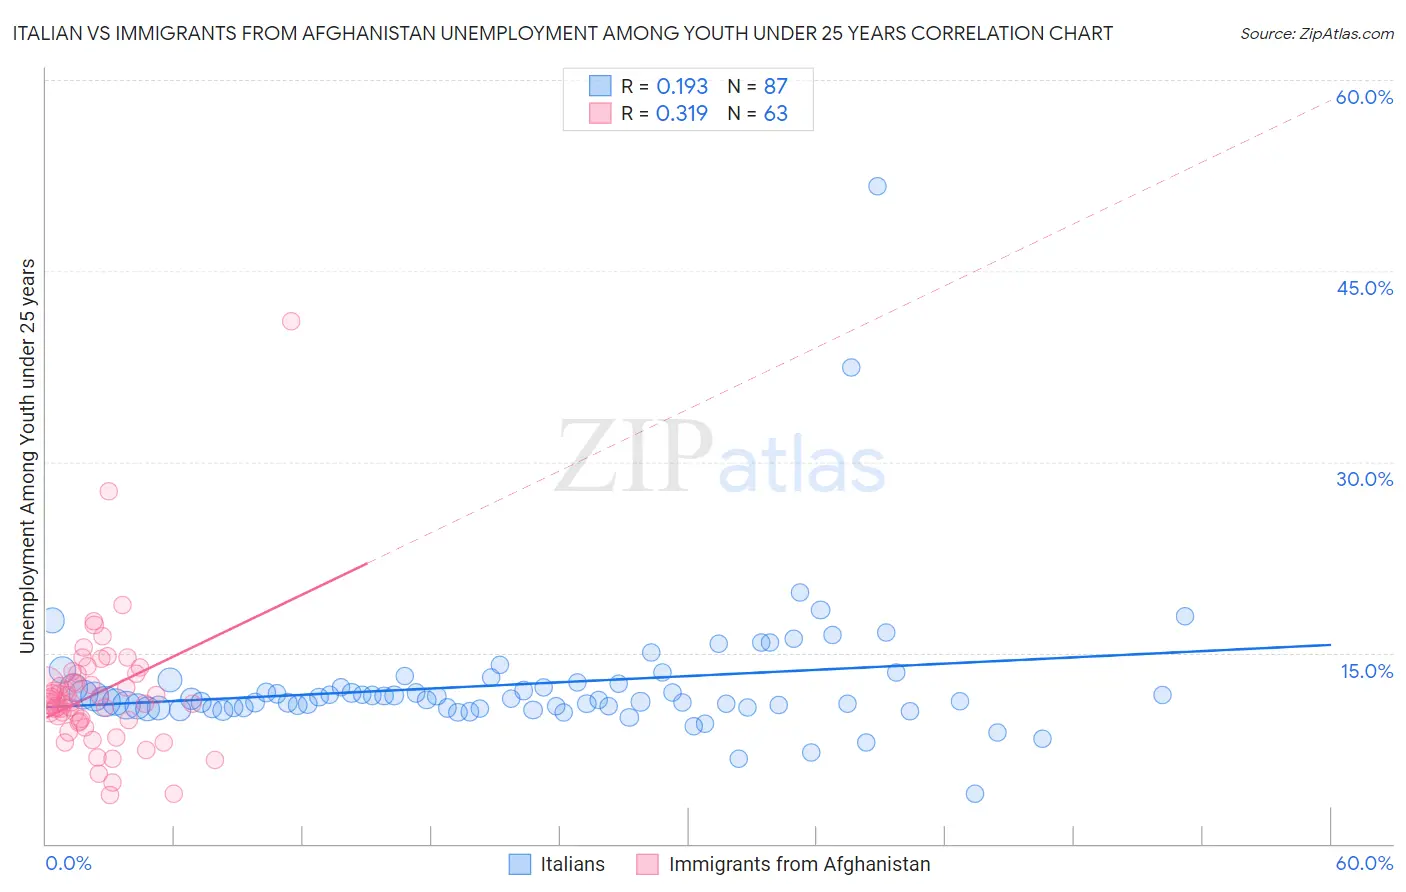
Italian vs Immigrants from Afghanistan Unemployment Among Youth under 25 years Correlation Chart
The statistical analysis conducted on geographies consisting of 549,839,385 people shows a poor positive correlation between the proportion of Italians and unemployment rate among youth under the age of 25 in the United States with a correlation coefficient (R) of 0.193 and weighted average of 11.4%. Similarly, the statistical analysis conducted on geographies consisting of 147,261,859 people shows a mild positive correlation between the proportion of Immigrants from Afghanistan and unemployment rate among youth under the age of 25 in the United States with a correlation coefficient (R) of 0.319 and weighted average of 11.3%, a difference of 0.78%.
Unemployment Among Youth under 25 years Correlation Summary
| Measurement | Italian | Immigrants from Afghanistan |
| Minimum | 3.9% | 3.8% |
| Maximum | 51.7% | 41.0% |
| Range | 47.8% | 37.2% |
| Mean | 12.5% | 11.8% |
| Median | 11.3% | 11.1% |
| Interquartile 25% (IQ1) | 10.7% | 9.6% |
| Interquartile 75% (IQ3) | 12.6% | 13.4% |
| Interquartile Range (IQR) | 1.8% | 3.7% |
| Standard Deviation (Sample) | 5.6% | 5.3% |
| Standard Deviation (Population) | 5.6% | 5.2% |
Demographics Similar to Italians and Immigrants from Afghanistan by Unemployment Among Youth under 25 years
In terms of unemployment among youth under 25 years, the demographic groups most similar to Italians are Basque (11.4%, a difference of 0.060%), Immigrants from Micronesia (11.4%, a difference of 0.090%), Slovak (11.4%, a difference of 0.17%), Malaysian (11.4%, a difference of 0.18%), and Immigrants from Scotland (11.4%, a difference of 0.21%). Similarly, the demographic groups most similar to Immigrants from Afghanistan are Immigrants from Jordan (11.3%, a difference of 0.060%), Chilean (11.3%, a difference of 0.070%), Immigrants from Lithuania (11.3%, a difference of 0.090%), Immigrants from Kuwait (11.3%, a difference of 0.10%), and Iranian (11.3%, a difference of 0.23%).
| Demographics | Rating | Rank | Unemployment Among Youth under 25 years |
| Immigrants | Afghanistan | 93.4 /100 | #104 | Exceptional 11.3% |
| Immigrants | Jordan | 93.1 /100 | #105 | Exceptional 11.3% |
| Chileans | 93.0 /100 | #106 | Exceptional 11.3% |
| Immigrants | Lithuania | 92.9 /100 | #107 | Exceptional 11.3% |
| Immigrants | Kuwait | 92.9 /100 | #108 | Exceptional 11.3% |
| Iranians | 92.0 /100 | #109 | Exceptional 11.3% |
| Immigrants | Norway | 91.5 /100 | #110 | Exceptional 11.3% |
| Immigrants | France | 90.3 /100 | #111 | Exceptional 11.3% |
| Immigrants | Austria | 90.3 /100 | #112 | Exceptional 11.3% |
| Fijians | 90.2 /100 | #113 | Exceptional 11.3% |
| Immigrants | Ethiopia | 89.9 /100 | #114 | Excellent 11.3% |
| Immigrants | Vietnam | 89.9 /100 | #115 | Excellent 11.3% |
| Burmese | 89.8 /100 | #116 | Excellent 11.3% |
| Sri Lankans | 89.8 /100 | #117 | Excellent 11.3% |
| Afghans | 89.7 /100 | #118 | Excellent 11.3% |
| Immigrants | Scotland | 89.2 /100 | #119 | Excellent 11.4% |
| Malaysians | 89.0 /100 | #120 | Excellent 11.4% |
| Slovaks | 88.9 /100 | #121 | Excellent 11.4% |
| Immigrants | Micronesia | 88.1 /100 | #122 | Excellent 11.4% |
| Basques | 87.8 /100 | #123 | Excellent 11.4% |
| Italians | 87.2 /100 | #124 | Excellent 11.4% |