Italian vs Immigrants from South Africa Unemployment
COMPARE
Italian
Immigrants from South Africa
Unemployment
Unemployment Comparison
Italians
Immigrants from South Africa
4.9%
UNEMPLOYMENT
98.9/ 100
METRIC RATING
64th/ 347
METRIC RANK
5.0%
UNEMPLOYMENT
96.2/ 100
METRIC RATING
92nd/ 347
METRIC RANK
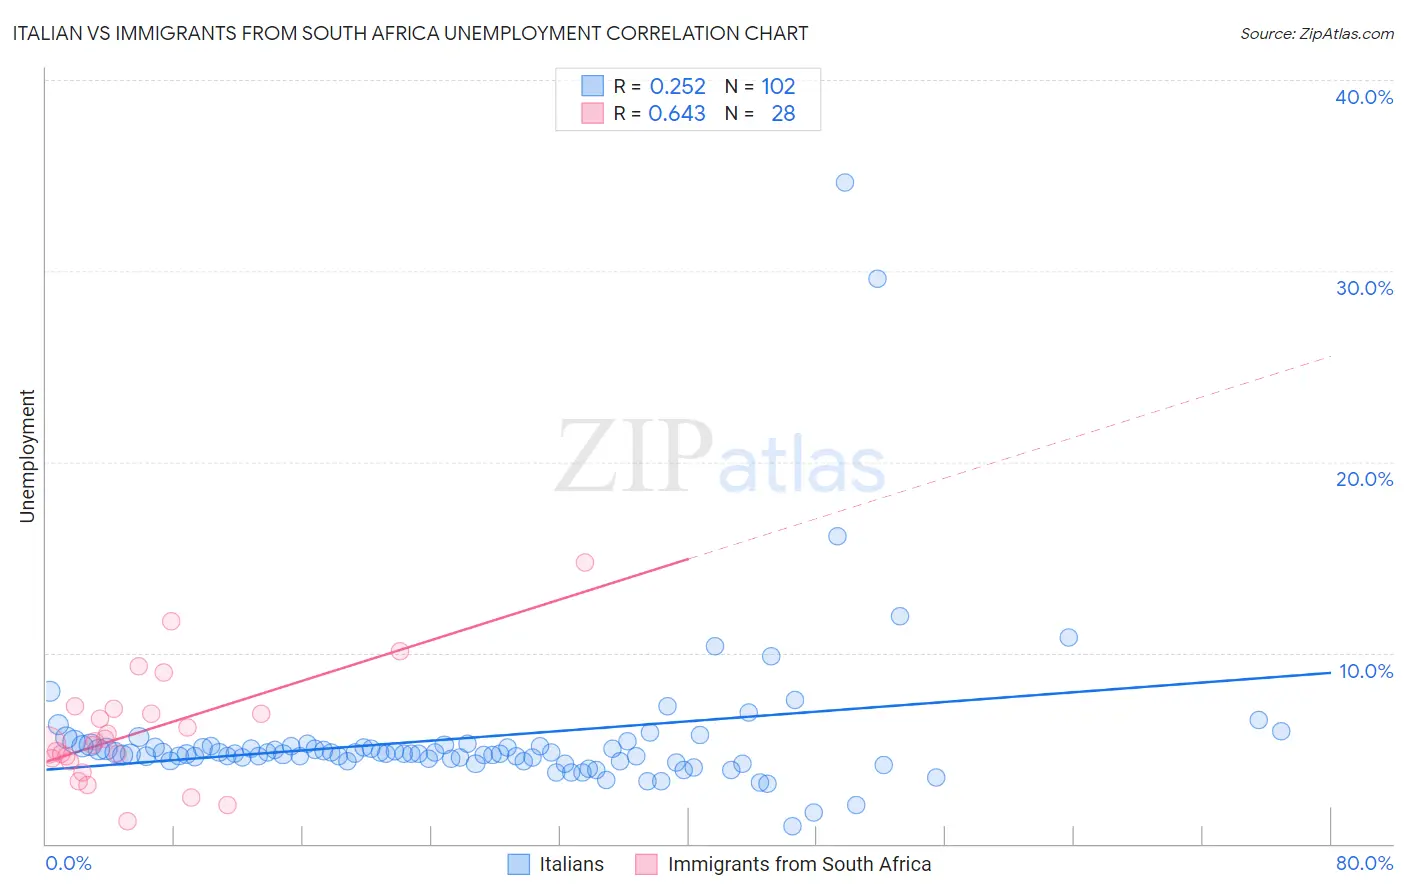
Italian vs Immigrants from South Africa Unemployment Correlation Chart
The statistical analysis conducted on geographies consisting of 570,806,314 people shows a weak positive correlation between the proportion of Italians and unemployment in the United States with a correlation coefficient (R) of 0.252 and weighted average of 4.9%. Similarly, the statistical analysis conducted on geographies consisting of 233,181,435 people shows a significant positive correlation between the proportion of Immigrants from South Africa and unemployment in the United States with a correlation coefficient (R) of 0.643 and weighted average of 5.0%, a difference of 2.1%.
Unemployment Correlation Summary
| Measurement | Italian | Immigrants from South Africa |
| Minimum | 0.90% | 1.2% |
| Maximum | 34.6% | 14.7% |
| Range | 33.7% | 13.5% |
| Mean | 5.6% | 5.9% |
| Median | 4.7% | 5.3% |
| Interquartile 25% (IQ1) | 4.3% | 4.4% |
| Interquartile 75% (IQ3) | 5.1% | 6.9% |
| Interquartile Range (IQR) | 0.77% | 2.5% |
| Standard Deviation (Sample) | 4.2% | 3.0% |
| Standard Deviation (Population) | 4.2% | 2.9% |
Similar Demographics by Unemployment
Demographics Similar to Italians by Unemployment
In terms of unemployment, the demographic groups most similar to Italians are Immigrants from Bulgaria (4.9%, a difference of 0.080%), Icelander (4.9%, a difference of 0.10%), Immigrants from Netherlands (4.9%, a difference of 0.11%), Cambodian (4.9%, a difference of 0.11%), and Immigrants from Canada (4.9%, a difference of 0.14%).
| Demographics | Rating | Rank | Unemployment |
| Immigrants | Singapore | 99.1 /100 | #57 | Exceptional 4.9% |
| Greeks | 99.0 /100 | #58 | Exceptional 4.9% |
| Bhutanese | 99.0 /100 | #59 | Exceptional 4.9% |
| Immigrants | Netherlands | 99.0 /100 | #60 | Exceptional 4.9% |
| Cambodians | 99.0 /100 | #61 | Exceptional 4.9% |
| Icelanders | 98.9 /100 | #62 | Exceptional 4.9% |
| Immigrants | Bulgaria | 98.9 /100 | #63 | Exceptional 4.9% |
| Italians | 98.9 /100 | #64 | Exceptional 4.9% |
| Immigrants | Canada | 98.8 /100 | #65 | Exceptional 4.9% |
| Slovaks | 98.7 /100 | #66 | Exceptional 4.9% |
| New Zealanders | 98.6 /100 | #67 | Exceptional 4.9% |
| Slavs | 98.6 /100 | #68 | Exceptional 4.9% |
| Immigrants | North America | 98.5 /100 | #69 | Exceptional 4.9% |
| Serbians | 98.4 /100 | #70 | Exceptional 4.9% |
| Immigrants | Japan | 98.3 /100 | #71 | Exceptional 4.9% |
Demographics Similar to Immigrants from South Africa by Unemployment
In terms of unemployment, the demographic groups most similar to Immigrants from South Africa are Immigrants from Sudan (5.0%, a difference of 0.020%), Immigrants from North Macedonia (5.0%, a difference of 0.030%), Jordanian (5.0%, a difference of 0.070%), Ukrainian (5.0%, a difference of 0.090%), and Immigrants from Austria (5.0%, a difference of 0.12%).
| Demographics | Rating | Rank | Unemployment |
| Immigrants | Australia | 97.0 /100 | #85 | Exceptional 5.0% |
| Hungarians | 96.9 /100 | #86 | Exceptional 5.0% |
| Immigrants | Moldova | 96.6 /100 | #87 | Exceptional 5.0% |
| Immigrants | Korea | 96.6 /100 | #88 | Exceptional 5.0% |
| Jordanians | 96.4 /100 | #89 | Exceptional 5.0% |
| Immigrants | North Macedonia | 96.3 /100 | #90 | Exceptional 5.0% |
| Immigrants | Sudan | 96.3 /100 | #91 | Exceptional 5.0% |
| Immigrants | South Africa | 96.2 /100 | #92 | Exceptional 5.0% |
| Ukrainians | 96.0 /100 | #93 | Exceptional 5.0% |
| Immigrants | Austria | 95.9 /100 | #94 | Exceptional 5.0% |
| Immigrants | Serbia | 95.6 /100 | #95 | Exceptional 5.0% |
| Immigrants | England | 95.2 /100 | #96 | Exceptional 5.0% |
| Immigrants | Czechoslovakia | 95.1 /100 | #97 | Exceptional 5.0% |
| Romanians | 95.0 /100 | #98 | Exceptional 5.0% |
| Mongolians | 94.8 /100 | #99 | Exceptional 5.0% |