Italian vs Immigrants from South Africa Disability Age Over 75
COMPARE
Italian
Immigrants from South Africa
Disability Age Over 75
Disability Age Over 75 Comparison
Italians
Immigrants from South Africa
45.6%
DISABILITY AGE OVER 75
99.9/ 100
METRIC RATING
38th/ 347
METRIC RANK
45.3%
DISABILITY AGE OVER 75
100.0/ 100
METRIC RATING
22nd/ 347
METRIC RANK
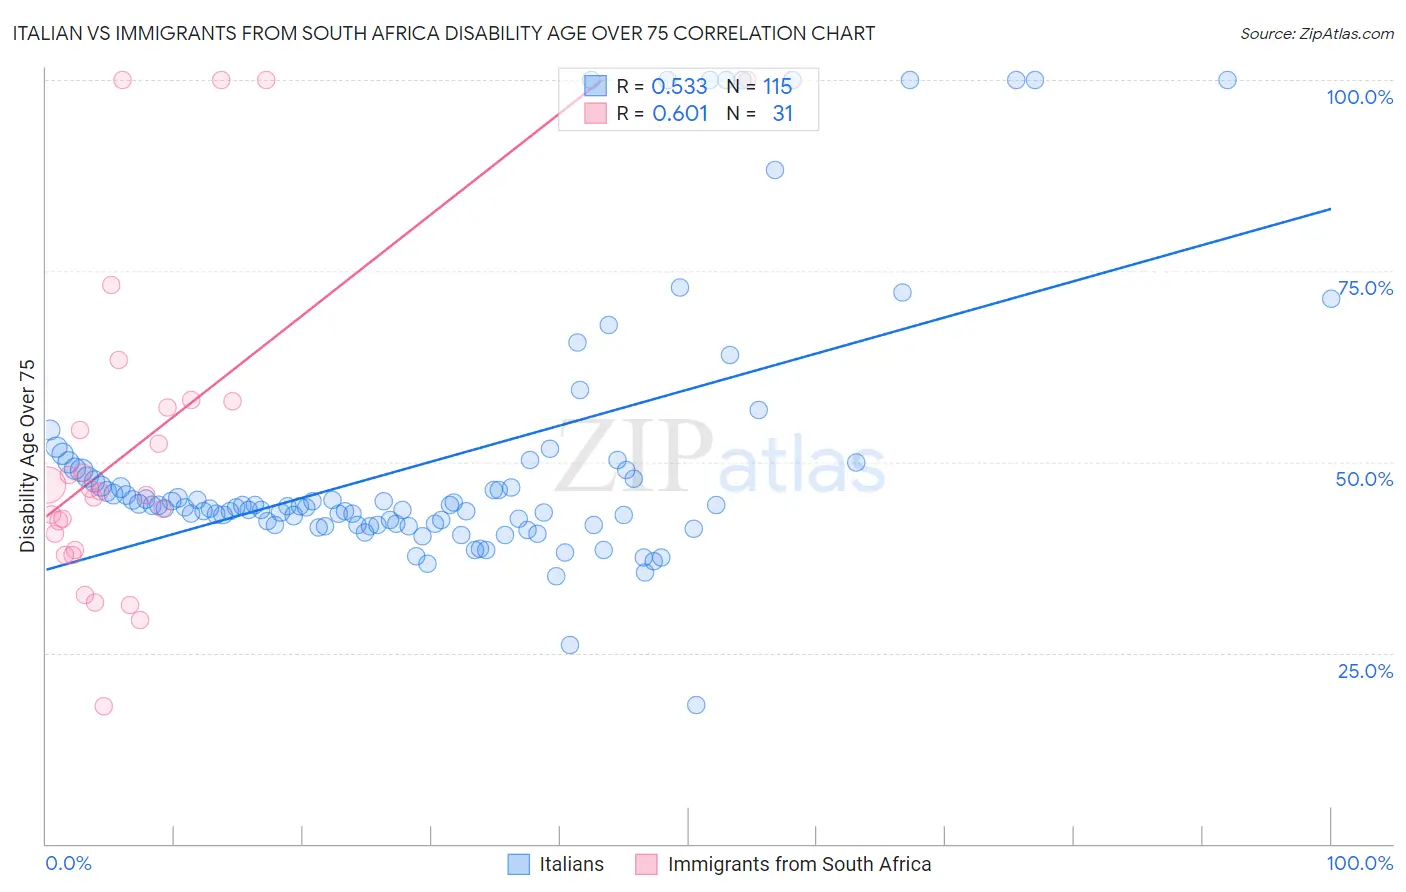
Italian vs Immigrants from South Africa Disability Age Over 75 Correlation Chart
The statistical analysis conducted on geographies consisting of 572,737,246 people shows a substantial positive correlation between the proportion of Italians and percentage of population with a disability over the age of 75 in the United States with a correlation coefficient (R) of 0.533 and weighted average of 45.6%. Similarly, the statistical analysis conducted on geographies consisting of 233,155,609 people shows a significant positive correlation between the proportion of Immigrants from South Africa and percentage of population with a disability over the age of 75 in the United States with a correlation coefficient (R) of 0.601 and weighted average of 45.3%, a difference of 0.53%.
Disability Age Over 75 Correlation Summary
| Measurement | Italian | Immigrants from South Africa |
| Minimum | 18.2% | 18.0% |
| Maximum | 100.0% | 100.0% |
| Range | 81.8% | 82.0% |
| Mean | 50.2% | 52.0% |
| Median | 44.2% | 46.2% |
| Interquartile 25% (IQ1) | 41.8% | 38.5% |
| Interquartile 75% (IQ3) | 48.9% | 57.9% |
| Interquartile Range (IQR) | 7.1% | 19.4% |
| Standard Deviation (Sample) | 17.6% | 21.6% |
| Standard Deviation (Population) | 17.6% | 21.3% |
Demographics Similar to Italians and Immigrants from South Africa by Disability Age Over 75
In terms of disability age over 75, the demographic groups most similar to Italians are South African (45.5%, a difference of 0.050%), Estonian (45.6%, a difference of 0.050%), Immigrants from Taiwan (45.5%, a difference of 0.060%), Russian (45.5%, a difference of 0.090%), and Norwegian (45.5%, a difference of 0.090%). Similarly, the demographic groups most similar to Immigrants from South Africa are Immigrants from Belgium (45.3%, a difference of 0.030%), Immigrants from Switzerland (45.3%, a difference of 0.030%), Polish (45.3%, a difference of 0.050%), Immigrants from Bolivia (45.4%, a difference of 0.10%), and Macedonian (45.4%, a difference of 0.13%).
| Demographics | Rating | Rank | Disability Age Over 75 |
| Immigrants | Serbia | 100.0 /100 | #20 | Exceptional 45.3% |
| Immigrants | Belgium | 100.0 /100 | #21 | Exceptional 45.3% |
| Immigrants | South Africa | 100.0 /100 | #22 | Exceptional 45.3% |
| Immigrants | Switzerland | 99.9 /100 | #23 | Exceptional 45.3% |
| Poles | 99.9 /100 | #24 | Exceptional 45.3% |
| Immigrants | Bolivia | 99.9 /100 | #25 | Exceptional 45.4% |
| Macedonians | 99.9 /100 | #26 | Exceptional 45.4% |
| Immigrants | Poland | 99.9 /100 | #27 | Exceptional 45.4% |
| Thais | 99.9 /100 | #28 | Exceptional 45.4% |
| Filipinos | 99.9 /100 | #29 | Exceptional 45.4% |
| Immigrants | Denmark | 99.9 /100 | #30 | Exceptional 45.4% |
| Immigrants | Bulgaria | 99.9 /100 | #31 | Exceptional 45.5% |
| Immigrants | Australia | 99.9 /100 | #32 | Exceptional 45.5% |
| Immigrants | Croatia | 99.9 /100 | #33 | Exceptional 45.5% |
| Russians | 99.9 /100 | #34 | Exceptional 45.5% |
| Norwegians | 99.9 /100 | #35 | Exceptional 45.5% |
| Immigrants | Taiwan | 99.9 /100 | #36 | Exceptional 45.5% |
| South Africans | 99.9 /100 | #37 | Exceptional 45.5% |
| Italians | 99.9 /100 | #38 | Exceptional 45.6% |
| Estonians | 99.9 /100 | #39 | Exceptional 45.6% |
| Slovenes | 99.9 /100 | #40 | Exceptional 45.6% |