Italian vs Russian Unemployment
COMPARE
Italian
Russian
Unemployment
Unemployment Comparison
Italians
Russians
4.9%
UNEMPLOYMENT
98.9/ 100
METRIC RATING
64th/ 347
METRIC RANK
5.0%
UNEMPLOYMENT
97.4/ 100
METRIC RATING
84th/ 347
METRIC RANK
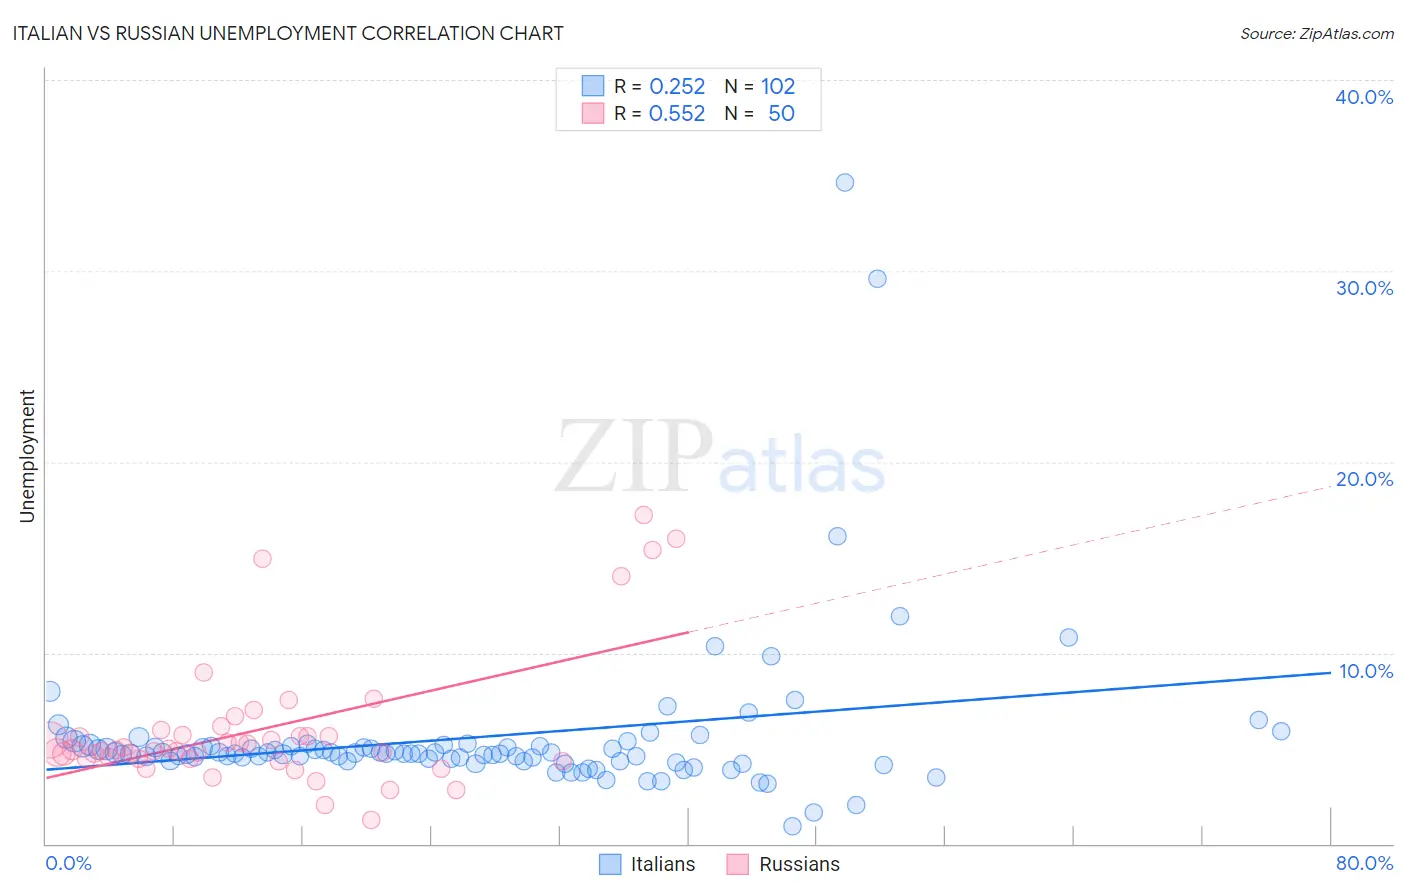
Italian vs Russian Unemployment Correlation Chart
The statistical analysis conducted on geographies consisting of 570,806,314 people shows a weak positive correlation between the proportion of Italians and unemployment in the United States with a correlation coefficient (R) of 0.252 and weighted average of 4.9%. Similarly, the statistical analysis conducted on geographies consisting of 510,522,932 people shows a substantial positive correlation between the proportion of Russians and unemployment in the United States with a correlation coefficient (R) of 0.552 and weighted average of 5.0%, a difference of 1.4%.
Unemployment Correlation Summary
| Measurement | Italian | Russian |
| Minimum | 0.90% | 1.3% |
| Maximum | 34.6% | 17.2% |
| Range | 33.7% | 15.9% |
| Mean | 5.6% | 6.0% |
| Median | 4.7% | 4.9% |
| Interquartile 25% (IQ1) | 4.3% | 4.5% |
| Interquartile 75% (IQ3) | 5.1% | 5.7% |
| Interquartile Range (IQR) | 0.77% | 1.2% |
| Standard Deviation (Sample) | 4.2% | 3.5% |
| Standard Deviation (Population) | 4.2% | 3.4% |
Demographics Similar to Italians and Russians by Unemployment
In terms of unemployment, the demographic groups most similar to Italians are Immigrants from Canada (4.9%, a difference of 0.14%), Slovak (4.9%, a difference of 0.29%), New Zealander (4.9%, a difference of 0.33%), Slavic (4.9%, a difference of 0.36%), and Immigrants from North America (4.9%, a difference of 0.45%). Similarly, the demographic groups most similar to Russians are Hmong (5.0%, a difference of 0.080%), Fijian (5.0%, a difference of 0.090%), Basque (5.0%, a difference of 0.10%), Immigrants from Sweden (5.0%, a difference of 0.11%), and Canadian (5.0%, a difference of 0.18%).
| Demographics | Rating | Rank | Unemployment |
| Italians | 98.9 /100 | #64 | Exceptional 4.9% |
| Immigrants | Canada | 98.8 /100 | #65 | Exceptional 4.9% |
| Slovaks | 98.7 /100 | #66 | Exceptional 4.9% |
| New Zealanders | 98.6 /100 | #67 | Exceptional 4.9% |
| Slavs | 98.6 /100 | #68 | Exceptional 4.9% |
| Immigrants | North America | 98.5 /100 | #69 | Exceptional 4.9% |
| Serbians | 98.4 /100 | #70 | Exceptional 4.9% |
| Immigrants | Japan | 98.3 /100 | #71 | Exceptional 4.9% |
| Burmese | 98.3 /100 | #72 | Exceptional 4.9% |
| Paraguayans | 98.3 /100 | #73 | Exceptional 4.9% |
| Immigrants | Northern Europe | 98.2 /100 | #74 | Exceptional 4.9% |
| Turks | 98.0 /100 | #75 | Exceptional 4.9% |
| German Russians | 98.0 /100 | #76 | Exceptional 4.9% |
| Cypriots | 97.9 /100 | #77 | Exceptional 4.9% |
| Okinawans | 97.9 /100 | #78 | Exceptional 4.9% |
| Canadians | 97.7 /100 | #79 | Exceptional 5.0% |
| Immigrants | Sweden | 97.6 /100 | #80 | Exceptional 5.0% |
| Basques | 97.6 /100 | #81 | Exceptional 5.0% |
| Fijians | 97.6 /100 | #82 | Exceptional 5.0% |
| Hmong | 97.6 /100 | #83 | Exceptional 5.0% |
| Russians | 97.4 /100 | #84 | Exceptional 5.0% |