Italian vs Scandinavian Unemployment Among Ages 45 to 54 years
COMPARE
Italian
Scandinavian
Unemployment Among Ages 45 to 54 years
Unemployment Among Ages 45 to 54 years Comparison
Italians
Scandinavians
4.3%
UNEMPLOYMENT AMONG AGES 45 TO 54 YEARS
97.3/ 100
METRIC RATING
84th/ 347
METRIC RANK
4.0%
UNEMPLOYMENT AMONG AGES 45 TO 54 YEARS
100.0/ 100
METRIC RATING
11th/ 347
METRIC RANK
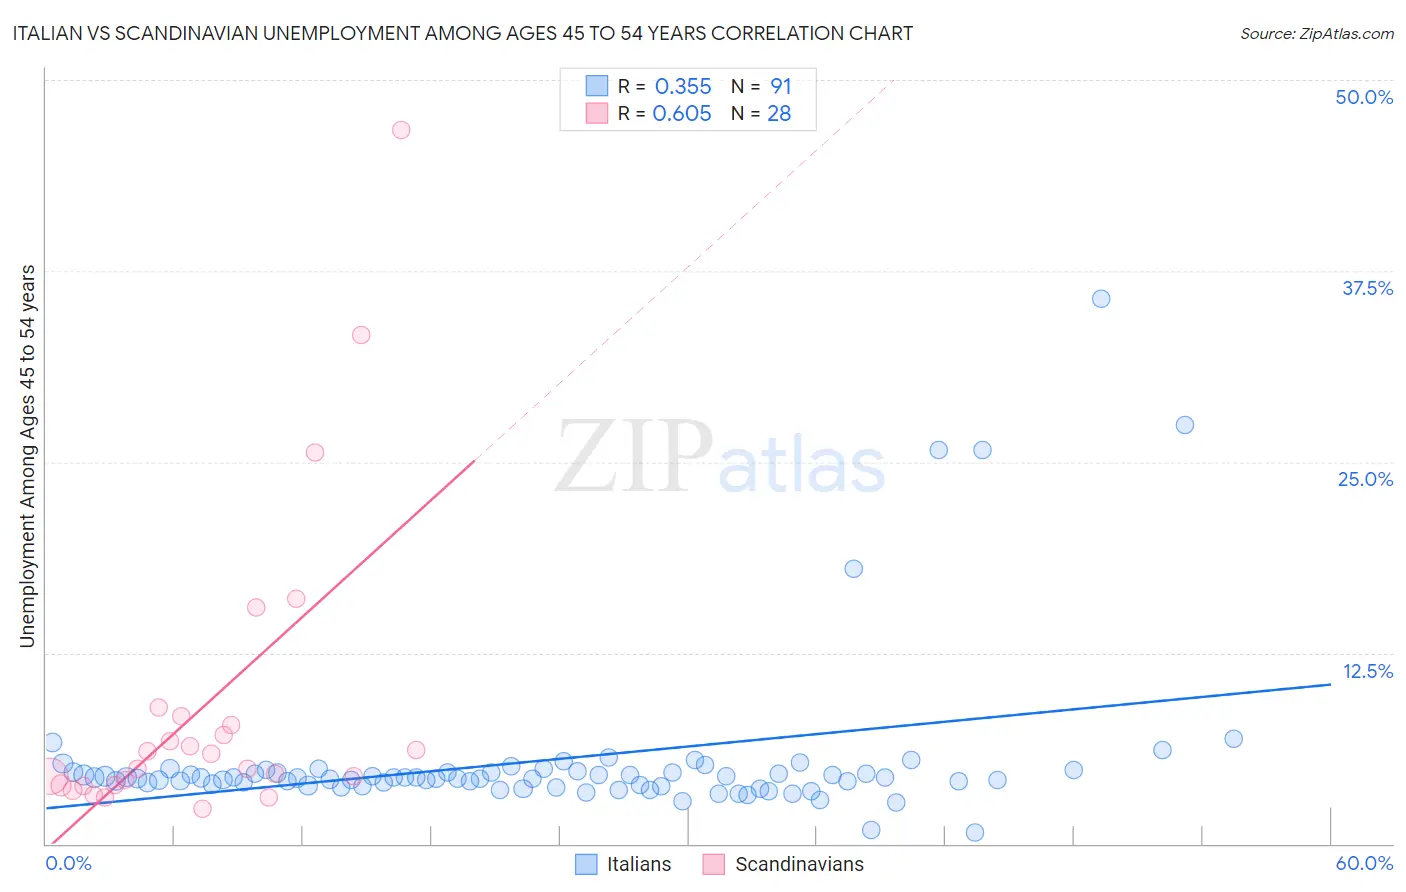
Italian vs Scandinavian Unemployment Among Ages 45 to 54 years Correlation Chart
The statistical analysis conducted on geographies consisting of 531,524,009 people shows a mild positive correlation between the proportion of Italians and unemployment rate among population between the ages 45 and 54 in the United States with a correlation coefficient (R) of 0.355 and weighted average of 4.3%. Similarly, the statistical analysis conducted on geographies consisting of 448,807,128 people shows a significant positive correlation between the proportion of Scandinavians and unemployment rate among population between the ages 45 and 54 in the United States with a correlation coefficient (R) of 0.605 and weighted average of 4.0%, a difference of 8.3%.
Unemployment Among Ages 45 to 54 years Correlation Summary
| Measurement | Italian | Scandinavian |
| Minimum | 0.70% | 2.3% |
| Maximum | 35.7% | 46.7% |
| Range | 35.0% | 44.4% |
| Mean | 5.5% | 9.1% |
| Median | 4.3% | 5.4% |
| Interquartile 25% (IQ1) | 3.8% | 3.8% |
| Interquartile 75% (IQ3) | 4.7% | 8.1% |
| Interquartile Range (IQR) | 0.89% | 4.2% |
| Standard Deviation (Sample) | 5.4% | 10.2% |
| Standard Deviation (Population) | 5.3% | 10.0% |
Similar Demographics by Unemployment Among Ages 45 to 54 years
Demographics Similar to Italians by Unemployment Among Ages 45 to 54 years
In terms of unemployment among ages 45 to 54 years, the demographic groups most similar to Italians are French (4.3%, a difference of 0.0%), Australian (4.3%, a difference of 0.040%), Ethiopian (4.3%, a difference of 0.040%), Eastern European (4.3%, a difference of 0.12%), and Sudanese (4.3%, a difference of 0.14%).
| Demographics | Rating | Rank | Unemployment Among Ages 45 to 54 years |
| Chileans | 98.1 /100 | #77 | Exceptional 4.3% |
| German Russians | 97.9 /100 | #78 | Exceptional 4.3% |
| Serbians | 97.9 /100 | #79 | Exceptional 4.3% |
| Cambodians | 97.8 /100 | #80 | Exceptional 4.3% |
| Immigrants | Micronesia | 97.6 /100 | #81 | Exceptional 4.3% |
| Eastern Europeans | 97.6 /100 | #82 | Exceptional 4.3% |
| Australians | 97.4 /100 | #83 | Exceptional 4.3% |
| Italians | 97.3 /100 | #84 | Exceptional 4.3% |
| French | 97.3 /100 | #85 | Exceptional 4.3% |
| Ethiopians | 97.2 /100 | #86 | Exceptional 4.3% |
| Sudanese | 97.0 /100 | #87 | Exceptional 4.3% |
| Immigrants | Turkey | 96.9 /100 | #88 | Exceptional 4.3% |
| Immigrants | Argentina | 96.9 /100 | #89 | Exceptional 4.3% |
| Asians | 96.8 /100 | #90 | Exceptional 4.3% |
| Ukrainians | 96.6 /100 | #91 | Exceptional 4.3% |
Demographics Similar to Scandinavians by Unemployment Among Ages 45 to 54 years
In terms of unemployment among ages 45 to 54 years, the demographic groups most similar to Scandinavians are Swedish (4.0%, a difference of 0.010%), Venezuelan (4.0%, a difference of 0.14%), Cuban (4.0%, a difference of 0.16%), Immigrants from Bosnia and Herzegovina (4.0%, a difference of 0.21%), and Immigrants from Bolivia (4.0%, a difference of 0.65%).
| Demographics | Rating | Rank | Unemployment Among Ages 45 to 54 years |
| Immigrants | India | 100.0 /100 | #4 | Exceptional 3.9% |
| Danes | 100.0 /100 | #5 | Exceptional 3.9% |
| Immigrants | Cuba | 100.0 /100 | #6 | Exceptional 3.9% |
| Immigrants | Venezuela | 100.0 /100 | #7 | Exceptional 3.9% |
| Chinese | 100.0 /100 | #8 | Exceptional 4.0% |
| Czechs | 100.0 /100 | #9 | Exceptional 4.0% |
| Venezuelans | 100.0 /100 | #10 | Exceptional 4.0% |
| Scandinavians | 100.0 /100 | #11 | Exceptional 4.0% |
| Swedes | 100.0 /100 | #12 | Exceptional 4.0% |
| Cubans | 100.0 /100 | #13 | Exceptional 4.0% |
| Immigrants | Bosnia and Herzegovina | 100.0 /100 | #14 | Exceptional 4.0% |
| Immigrants | Bolivia | 100.0 /100 | #15 | Exceptional 4.0% |
| Thais | 100.0 /100 | #16 | Exceptional 4.0% |
| Tongans | 100.0 /100 | #17 | Exceptional 4.1% |
| Germans | 100.0 /100 | #18 | Exceptional 4.1% |