Iroquois vs European Unemployment Among Youth under 25 years
COMPARE
Iroquois
European
Unemployment Among Youth under 25 years
Unemployment Among Youth under 25 years Comparison
Iroquois
Europeans
11.3%
UNEMPLOYMENT AMONG YOUTH UNDER 25 YEARS
93.8/ 100
METRIC RATING
101st/ 347
METRIC RANK
10.8%
UNEMPLOYMENT AMONG YOUTH UNDER 25 YEARS
99.9/ 100
METRIC RATING
33rd/ 347
METRIC RANK
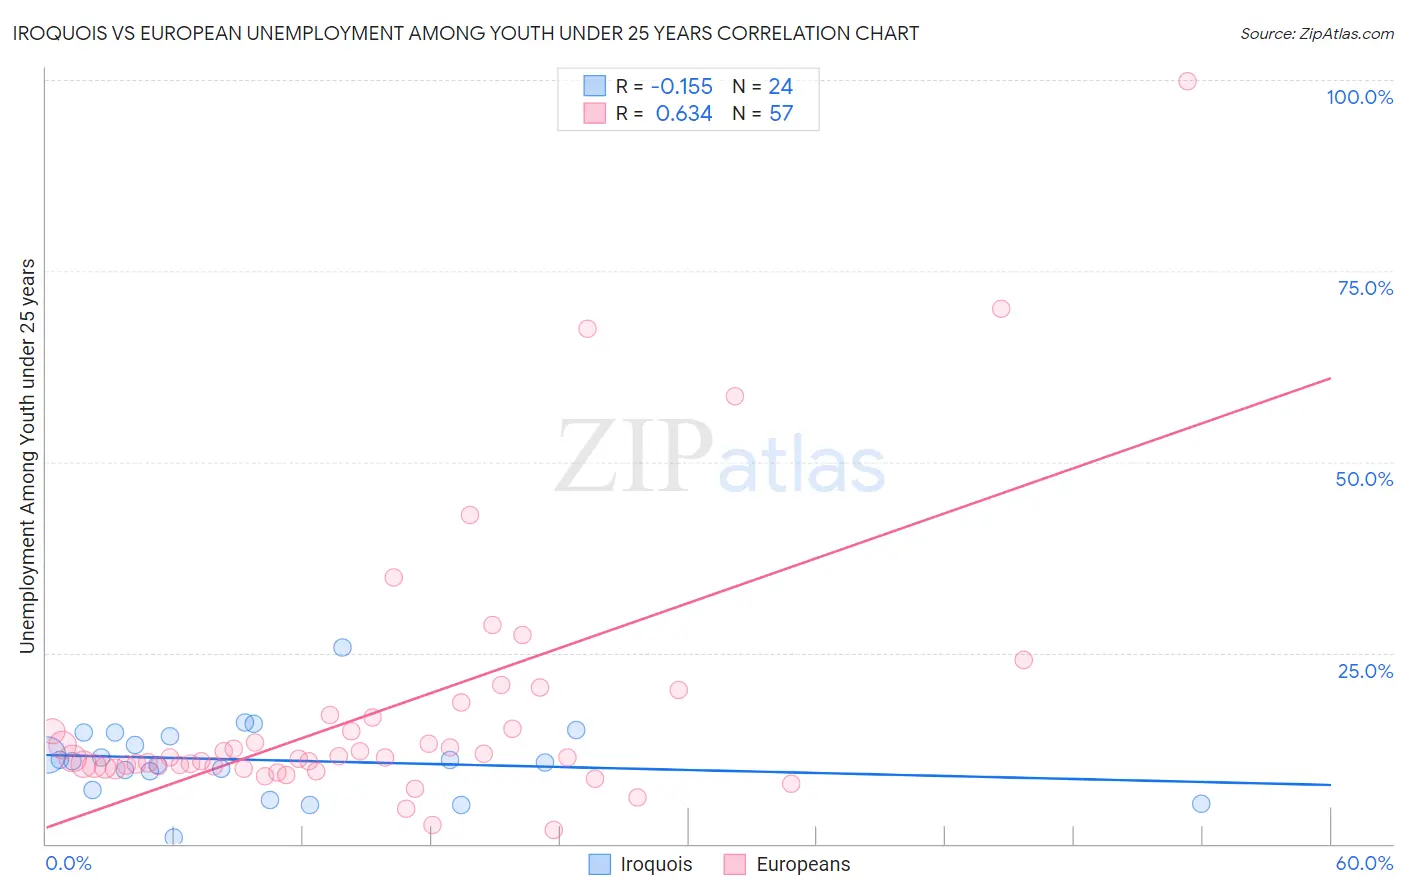
Iroquois vs European Unemployment Among Youth under 25 years Correlation Chart
The statistical analysis conducted on geographies consisting of 205,569,055 people shows a poor negative correlation between the proportion of Iroquois and unemployment rate among youth under the age of 25 in the United States with a correlation coefficient (R) of -0.155 and weighted average of 11.3%. Similarly, the statistical analysis conducted on geographies consisting of 539,832,325 people shows a significant positive correlation between the proportion of Europeans and unemployment rate among youth under the age of 25 in the United States with a correlation coefficient (R) of 0.634 and weighted average of 10.8%, a difference of 4.6%.
Unemployment Among Youth under 25 years Correlation Summary
| Measurement | Iroquois | European |
| Minimum | 0.80% | 1.8% |
| Maximum | 25.7% | 99.9% |
| Range | 24.9% | 98.1% |
| Mean | 11.0% | 17.5% |
| Median | 10.9% | 11.3% |
| Interquartile 25% (IQ1) | 8.3% | 10.1% |
| Interquartile 75% (IQ3) | 14.3% | 16.7% |
| Interquartile Range (IQR) | 6.0% | 6.6% |
| Standard Deviation (Sample) | 5.0% | 17.7% |
| Standard Deviation (Population) | 4.9% | 17.5% |
Similar Demographics by Unemployment Among Youth under 25 years
Demographics Similar to Iroquois by Unemployment Among Youth under 25 years
In terms of unemployment among youth under 25 years, the demographic groups most similar to Iroquois are Pakistani (11.3%, a difference of 0.020%), Celtic (11.3%, a difference of 0.030%), Immigrants from Thailand (11.3%, a difference of 0.050%), Immigrants from Malaysia (11.3%, a difference of 0.050%), and Immigrants from Afghanistan (11.3%, a difference of 0.070%).
| Demographics | Rating | Rank | Unemployment Among Youth under 25 years |
| Lithuanians | 94.8 /100 | #94 | Exceptional 11.3% |
| Carpatho Rusyns | 94.4 /100 | #95 | Exceptional 11.3% |
| Immigrants | Serbia | 94.4 /100 | #96 | Exceptional 11.3% |
| Nicaraguans | 94.3 /100 | #97 | Exceptional 11.3% |
| Estonians | 94.2 /100 | #98 | Exceptional 11.3% |
| Celtics | 94.0 /100 | #99 | Exceptional 11.3% |
| Pakistanis | 94.0 /100 | #100 | Exceptional 11.3% |
| Iroquois | 93.8 /100 | #101 | Exceptional 11.3% |
| Immigrants | Thailand | 93.6 /100 | #102 | Exceptional 11.3% |
| Immigrants | Malaysia | 93.6 /100 | #103 | Exceptional 11.3% |
| Immigrants | Afghanistan | 93.4 /100 | #104 | Exceptional 11.3% |
| Immigrants | Jordan | 93.1 /100 | #105 | Exceptional 11.3% |
| Chileans | 93.0 /100 | #106 | Exceptional 11.3% |
| Immigrants | Lithuania | 92.9 /100 | #107 | Exceptional 11.3% |
| Immigrants | Kuwait | 92.9 /100 | #108 | Exceptional 11.3% |
Demographics Similar to Europeans by Unemployment Among Youth under 25 years
In terms of unemployment among youth under 25 years, the demographic groups most similar to Europeans are Taiwanese (10.8%, a difference of 0.22%), English (10.8%, a difference of 0.27%), Immigrants from Nepal (10.8%, a difference of 0.35%), Slovene (10.7%, a difference of 0.48%), and Hmong (10.8%, a difference of 0.48%).
| Demographics | Rating | Rank | Unemployment Among Youth under 25 years |
| Immigrants | India | 100.0 /100 | #26 | Exceptional 10.7% |
| Yugoslavians | 100.0 /100 | #27 | Exceptional 10.7% |
| Somalis | 100.0 /100 | #28 | Exceptional 10.7% |
| Chinese | 99.9 /100 | #29 | Exceptional 10.7% |
| Osage | 99.9 /100 | #30 | Exceptional 10.7% |
| Slovenes | 99.9 /100 | #31 | Exceptional 10.7% |
| Taiwanese | 99.9 /100 | #32 | Exceptional 10.8% |
| Europeans | 99.9 /100 | #33 | Exceptional 10.8% |
| English | 99.9 /100 | #34 | Exceptional 10.8% |
| Immigrants | Nepal | 99.9 /100 | #35 | Exceptional 10.8% |
| Hmong | 99.8 /100 | #36 | Exceptional 10.8% |
| Immigrants | Zimbabwe | 99.8 /100 | #37 | Exceptional 10.8% |
| Immigrants | Congo | 99.8 /100 | #38 | Exceptional 10.9% |
| Immigrants | Zaire | 99.8 /100 | #39 | Exceptional 10.9% |
| Scottish | 99.8 /100 | #40 | Exceptional 10.9% |