Iroquois vs Macedonian Unemployment Among Seniors over 75 years
COMPARE
Iroquois
Macedonian
Unemployment Among Seniors over 75 years
Unemployment Among Seniors over 75 years Comparison
Iroquois
Macedonians
9.3%
UNEMPLOYMENT AMONG SENIORS OVER 75 YEARS
0.7/ 100
METRIC RATING
264th/ 347
METRIC RANK
9.6%
UNEMPLOYMENT AMONG SENIORS OVER 75 YEARS
0.0/ 100
METRIC RATING
282nd/ 347
METRIC RANK
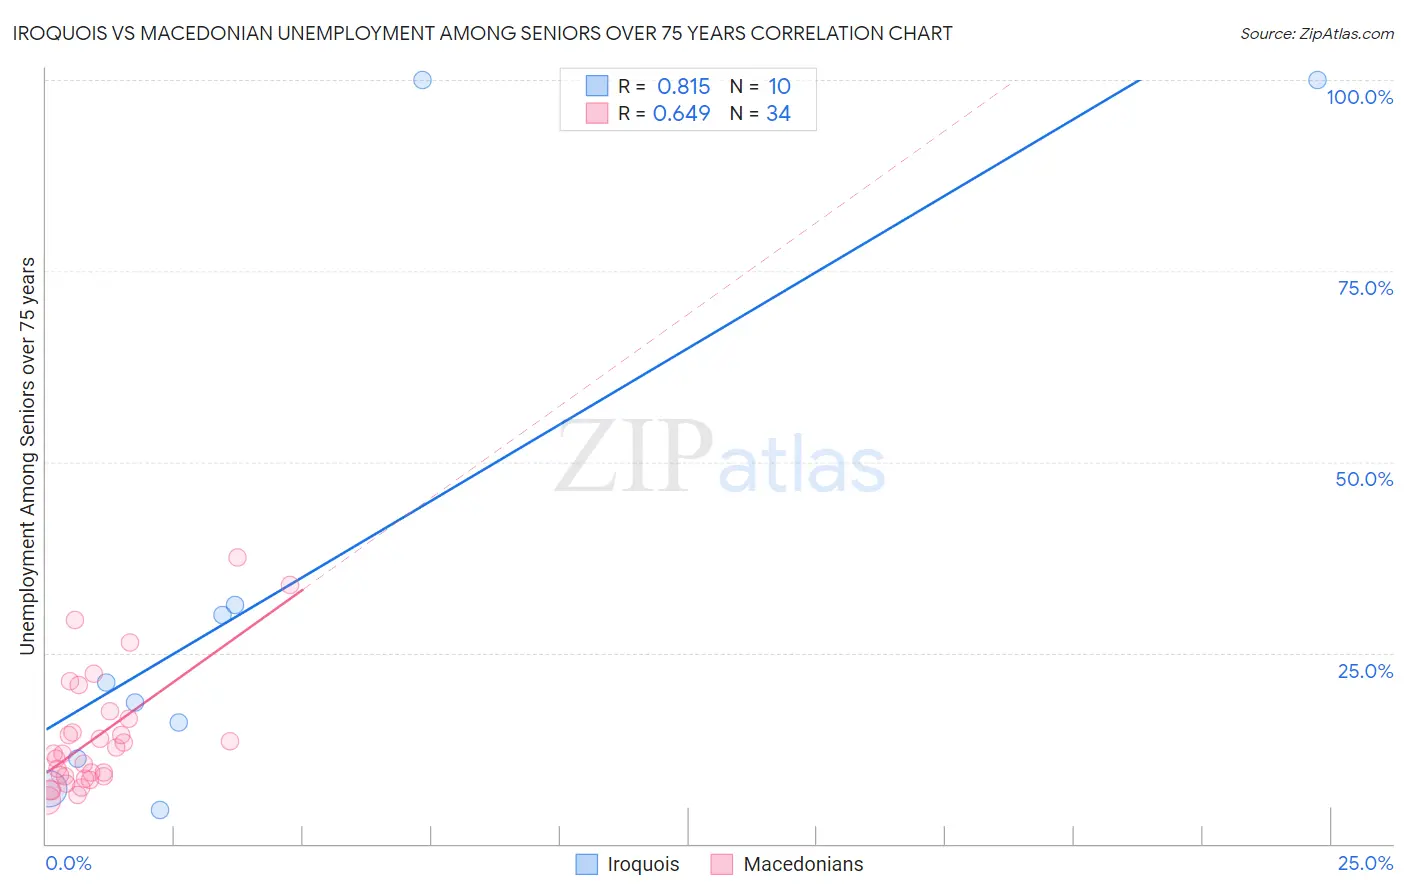
Iroquois vs Macedonian Unemployment Among Seniors over 75 years Correlation Chart
The statistical analysis conducted on geographies consisting of 125,150,870 people shows a very strong positive correlation between the proportion of Iroquois and unemployment rate among seniors over the age of 75 in the United States with a correlation coefficient (R) of 0.815 and weighted average of 9.3%. Similarly, the statistical analysis conducted on geographies consisting of 91,217,023 people shows a significant positive correlation between the proportion of Macedonians and unemployment rate among seniors over the age of 75 in the United States with a correlation coefficient (R) of 0.649 and weighted average of 9.6%, a difference of 3.3%.
Unemployment Among Seniors over 75 years Correlation Summary
| Measurement | Iroquois | Macedonian |
| Minimum | 4.3% | 5.7% |
| Maximum | 100.0% | 37.5% |
| Range | 95.7% | 31.8% |
| Mean | 34.0% | 14.1% |
| Median | 19.8% | 11.8% |
| Interquartile 25% (IQ1) | 11.2% | 8.8% |
| Interquartile 75% (IQ3) | 31.3% | 16.3% |
| Interquartile Range (IQR) | 20.1% | 7.5% |
| Standard Deviation (Sample) | 35.9% | 7.9% |
| Standard Deviation (Population) | 34.0% | 7.8% |
Demographics Similar to Iroquois and Macedonians by Unemployment Among Seniors over 75 years
In terms of unemployment among seniors over 75 years, the demographic groups most similar to Iroquois are Ukrainian (9.3%, a difference of 0.010%), Palestinian (9.3%, a difference of 0.12%), Black/African American (9.4%, a difference of 0.45%), Immigrants from Mexico (9.4%, a difference of 0.57%), and Greek (9.4%, a difference of 0.73%). Similarly, the demographic groups most similar to Macedonians are Immigrants from Nigeria (9.6%, a difference of 0.030%), Bangladeshi (9.6%, a difference of 0.34%), Croatian (9.6%, a difference of 0.50%), British (9.6%, a difference of 0.64%), and Immigrants from Senegal (9.6%, a difference of 0.79%).
| Demographics | Rating | Rank | Unemployment Among Seniors over 75 years |
| Ukrainians | 0.7 /100 | #263 | Tragic 9.3% |
| Iroquois | 0.7 /100 | #264 | Tragic 9.3% |
| Palestinians | 0.6 /100 | #265 | Tragic 9.3% |
| Blacks/African Americans | 0.5 /100 | #266 | Tragic 9.4% |
| Immigrants | Mexico | 0.4 /100 | #267 | Tragic 9.4% |
| Greeks | 0.4 /100 | #268 | Tragic 9.4% |
| Puerto Ricans | 0.3 /100 | #269 | Tragic 9.4% |
| Yaqui | 0.3 /100 | #270 | Tragic 9.4% |
| Bulgarians | 0.3 /100 | #271 | Tragic 9.4% |
| Immigrants | Iraq | 0.3 /100 | #272 | Tragic 9.4% |
| Czechoslovakians | 0.3 /100 | #273 | Tragic 9.4% |
| Jamaicans | 0.2 /100 | #274 | Tragic 9.5% |
| Senegalese | 0.2 /100 | #275 | Tragic 9.5% |
| Arabs | 0.2 /100 | #276 | Tragic 9.5% |
| Swiss | 0.1 /100 | #277 | Tragic 9.5% |
| Immigrants | Senegal | 0.1 /100 | #278 | Tragic 9.6% |
| British | 0.1 /100 | #279 | Tragic 9.6% |
| Croatians | 0.1 /100 | #280 | Tragic 9.6% |
| Bangladeshis | 0.1 /100 | #281 | Tragic 9.6% |
| Macedonians | 0.0 /100 | #282 | Tragic 9.6% |
| Immigrants | Nigeria | 0.0 /100 | #283 | Tragic 9.6% |