Finnish vs Macedonian Unemployment Among Seniors over 75 years
COMPARE
Finnish
Macedonian
Unemployment Among Seniors over 75 years
Unemployment Among Seniors over 75 years Comparison
Finns
Macedonians
10.0%
UNEMPLOYMENT AMONG SENIORS OVER 75 YEARS
0.0/ 100
METRIC RATING
302nd/ 347
METRIC RANK
9.6%
UNEMPLOYMENT AMONG SENIORS OVER 75 YEARS
0.0/ 100
METRIC RATING
282nd/ 347
METRIC RANK
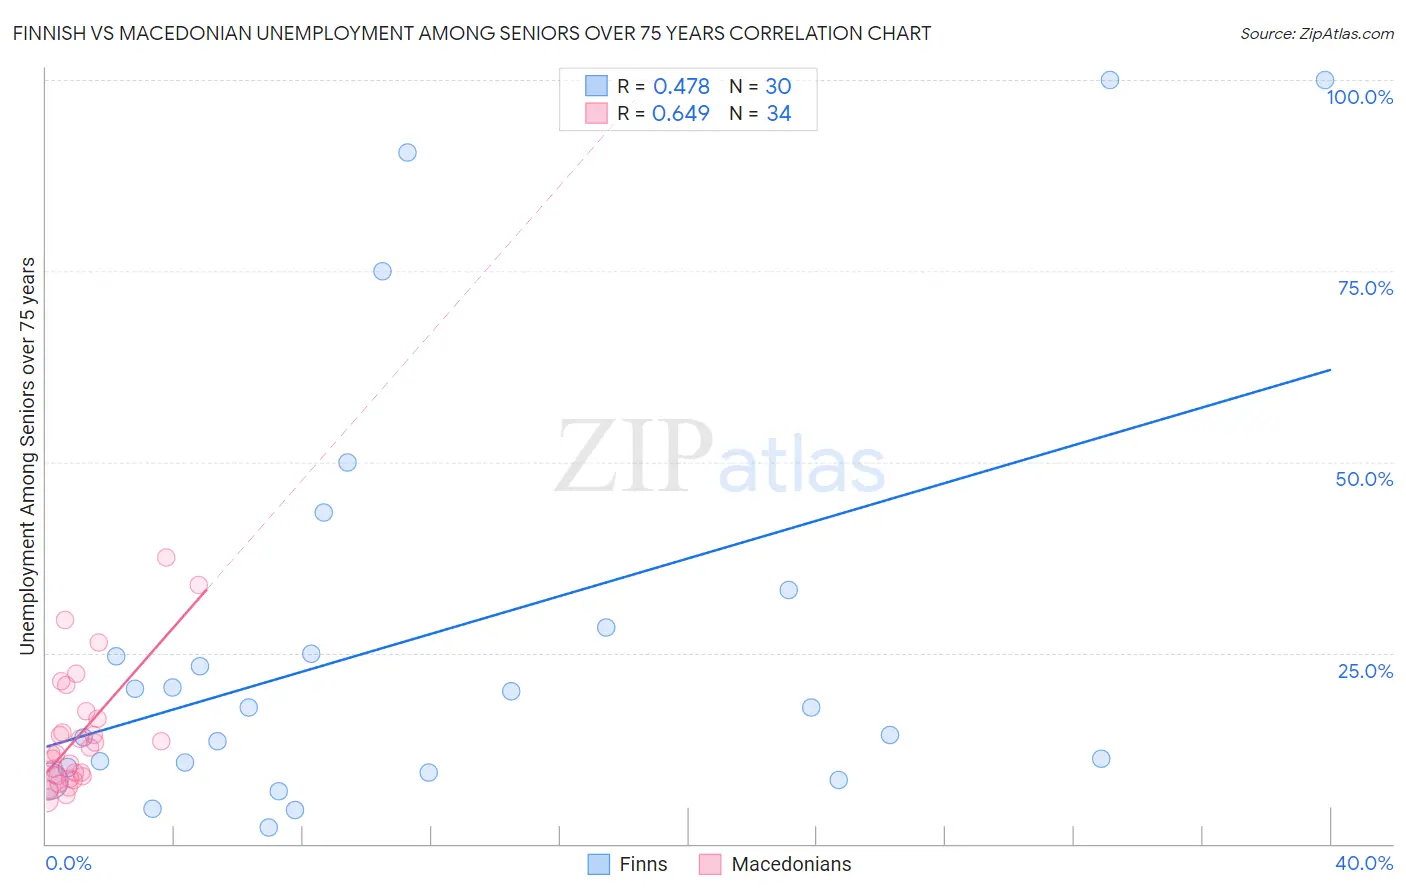
Finnish vs Macedonian Unemployment Among Seniors over 75 years Correlation Chart
The statistical analysis conducted on geographies consisting of 198,752,301 people shows a moderate positive correlation between the proportion of Finns and unemployment rate among seniors over the age of 75 in the United States with a correlation coefficient (R) of 0.478 and weighted average of 10.0%. Similarly, the statistical analysis conducted on geographies consisting of 91,217,023 people shows a significant positive correlation between the proportion of Macedonians and unemployment rate among seniors over the age of 75 in the United States with a correlation coefficient (R) of 0.649 and weighted average of 9.6%, a difference of 3.4%.
Unemployment Among Seniors over 75 years Correlation Summary
| Measurement | Finnish | Macedonian |
| Minimum | 2.1% | 5.7% |
| Maximum | 100.0% | 37.5% |
| Range | 97.9% | 31.8% |
| Mean | 27.3% | 14.1% |
| Median | 17.9% | 11.8% |
| Interquartile 25% (IQ1) | 10.0% | 8.8% |
| Interquartile 75% (IQ3) | 28.3% | 16.3% |
| Interquartile Range (IQR) | 18.2% | 7.5% |
| Standard Deviation (Sample) | 28.0% | 7.9% |
| Standard Deviation (Population) | 27.6% | 7.8% |
Demographics Similar to Finns and Macedonians by Unemployment Among Seniors over 75 years
In terms of unemployment among seniors over 75 years, the demographic groups most similar to Finns are Welsh (10.0%, a difference of 0.11%), Iraqi (9.9%, a difference of 0.53%), Belgian (9.9%, a difference of 0.55%), Lithuanian (9.9%, a difference of 0.83%), and Cherokee (9.8%, a difference of 1.2%). Similarly, the demographic groups most similar to Macedonians are Immigrants from Nigeria (9.6%, a difference of 0.030%), European (9.7%, a difference of 0.25%), Carpatho Rusyn (9.7%, a difference of 0.28%), Nigerian (9.7%, a difference of 0.34%), and Danish (9.7%, a difference of 0.45%).
| Demographics | Rating | Rank | Unemployment Among Seniors over 75 years |
| Macedonians | 0.0 /100 | #282 | Tragic 9.6% |
| Immigrants | Nigeria | 0.0 /100 | #283 | Tragic 9.6% |
| Europeans | 0.0 /100 | #284 | Tragic 9.7% |
| Carpatho Rusyns | 0.0 /100 | #285 | Tragic 9.7% |
| Nigerians | 0.0 /100 | #286 | Tragic 9.7% |
| Danes | 0.0 /100 | #287 | Tragic 9.7% |
| Canadians | 0.0 /100 | #288 | Tragic 9.7% |
| Czechs | 0.0 /100 | #289 | Tragic 9.7% |
| Sioux | 0.0 /100 | #290 | Tragic 9.7% |
| Scandinavians | 0.0 /100 | #291 | Tragic 9.7% |
| Immigrants | Western Africa | 0.0 /100 | #292 | Tragic 9.8% |
| Norwegians | 0.0 /100 | #293 | Tragic 9.8% |
| Immigrants | Dominica | 0.0 /100 | #294 | Tragic 9.8% |
| Immigrants | Nonimmigrants | 0.0 /100 | #295 | Tragic 9.8% |
| Immigrants | St. Vincent and the Grenadines | 0.0 /100 | #296 | Tragic 9.8% |
| Cherokee | 0.0 /100 | #297 | Tragic 9.8% |
| Lithuanians | 0.0 /100 | #298 | Tragic 9.9% |
| Belgians | 0.0 /100 | #299 | Tragic 9.9% |
| Iraqis | 0.0 /100 | #300 | Tragic 9.9% |
| Welsh | 0.0 /100 | #301 | Tragic 10.0% |
| Finns | 0.0 /100 | #302 | Tragic 10.0% |