Chinese vs Immigrants from Fiji Unemployment Among Women with Children Under 6 years
COMPARE
Chinese
Immigrants from Fiji
Unemployment Among Women with Children Under 6 years
Unemployment Among Women with Children Under 6 years Comparison
Chinese
Immigrants from Fiji
6.8%
UNEMPLOYMENT AMONG WOMEN WITH CHILDREN UNDER 6 YEARS
99.9/ 100
METRIC RATING
53rd/ 347
METRIC RANK
7.1%
UNEMPLOYMENT AMONG WOMEN WITH CHILDREN UNDER 6 YEARS
98.9/ 100
METRIC RATING
79th/ 347
METRIC RANK
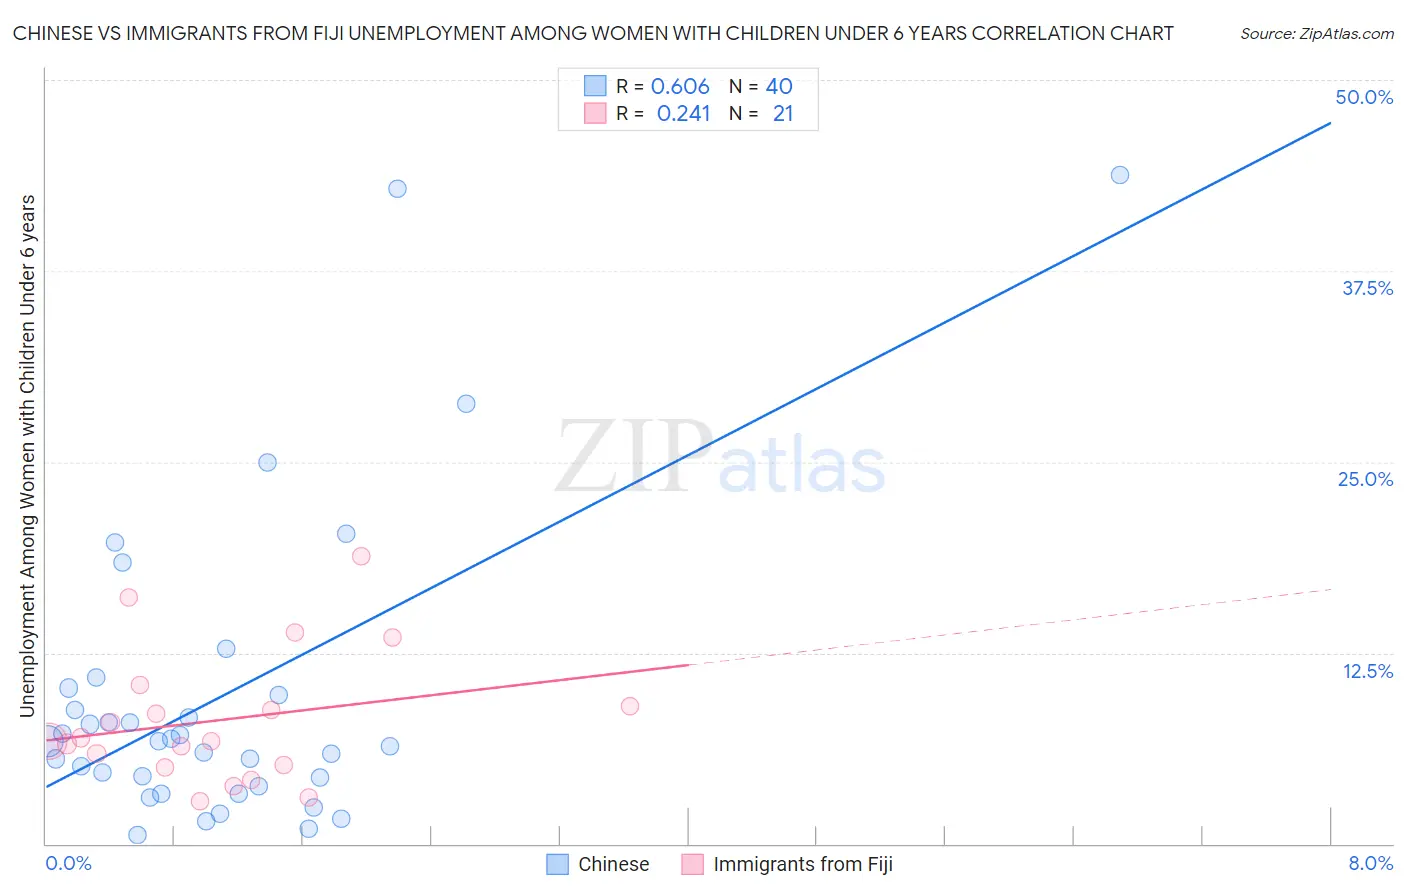
Chinese vs Immigrants from Fiji Unemployment Among Women with Children Under 6 years Correlation Chart
The statistical analysis conducted on geographies consisting of 60,145,529 people shows a significant positive correlation between the proportion of Chinese and unemployment rate among women with children under the age of 6 in the United States with a correlation coefficient (R) of 0.606 and weighted average of 6.8%. Similarly, the statistical analysis conducted on geographies consisting of 86,922,643 people shows a weak positive correlation between the proportion of Immigrants from Fiji and unemployment rate among women with children under the age of 6 in the United States with a correlation coefficient (R) of 0.241 and weighted average of 7.1%, a difference of 4.1%.
Unemployment Among Women with Children Under 6 years Correlation Summary
| Measurement | Chinese | Immigrants from Fiji |
| Minimum | 0.58% | 2.8% |
| Maximum | 43.8% | 18.8% |
| Range | 43.2% | 16.0% |
| Mean | 9.7% | 8.1% |
| Median | 6.7% | 6.7% |
| Interquartile 25% (IQ1) | 4.1% | 5.1% |
| Interquartile 75% (IQ3) | 9.9% | 9.7% |
| Interquartile Range (IQR) | 5.9% | 4.7% |
| Standard Deviation (Sample) | 10.1% | 4.3% |
| Standard Deviation (Population) | 9.9% | 4.2% |
Similar Demographics by Unemployment Among Women with Children Under 6 years
Demographics Similar to Chinese by Unemployment Among Women with Children Under 6 years
In terms of unemployment among women with children under 6 years, the demographic groups most similar to Chinese are Immigrants from Iran (6.8%, a difference of 0.070%), Immigrants from Latvia (6.8%, a difference of 0.17%), Ethiopian (6.8%, a difference of 0.19%), Immigrants from Ireland (6.8%, a difference of 0.20%), and Immigrants from Nepal (6.8%, a difference of 0.21%).
| Demographics | Rating | Rank | Unemployment Among Women with Children Under 6 years |
| Latvians | 99.9 /100 | #46 | Exceptional 6.8% |
| Immigrants | Asia | 99.9 /100 | #47 | Exceptional 6.8% |
| Immigrants | Switzerland | 99.9 /100 | #48 | Exceptional 6.8% |
| Immigrants | Nepal | 99.9 /100 | #49 | Exceptional 6.8% |
| Immigrants | Ireland | 99.9 /100 | #50 | Exceptional 6.8% |
| Ethiopians | 99.9 /100 | #51 | Exceptional 6.8% |
| Immigrants | Iran | 99.9 /100 | #52 | Exceptional 6.8% |
| Chinese | 99.9 /100 | #53 | Exceptional 6.8% |
| Immigrants | Latvia | 99.9 /100 | #54 | Exceptional 6.8% |
| Immigrants | Ukraine | 99.8 /100 | #55 | Exceptional 6.8% |
| Immigrants | Ethiopia | 99.8 /100 | #56 | Exceptional 6.9% |
| Icelanders | 99.8 /100 | #57 | Exceptional 6.9% |
| Immigrants | Turkey | 99.8 /100 | #58 | Exceptional 6.9% |
| Immigrants | Serbia | 99.8 /100 | #59 | Exceptional 6.9% |
| Immigrants | Sri Lanka | 99.8 /100 | #60 | Exceptional 6.9% |
Demographics Similar to Immigrants from Fiji by Unemployment Among Women with Children Under 6 years
In terms of unemployment among women with children under 6 years, the demographic groups most similar to Immigrants from Fiji are Immigrants from Greece (7.1%, a difference of 0.020%), Immigrants from Somalia (7.1%, a difference of 0.050%), Immigrants from Venezuela (7.1%, a difference of 0.060%), Immigrants from Croatia (7.1%, a difference of 0.090%), and Estonian (7.1%, a difference of 0.12%).
| Demographics | Rating | Rank | Unemployment Among Women with Children Under 6 years |
| Cubans | 99.4 /100 | #72 | Exceptional 7.0% |
| Immigrants | Czechoslovakia | 99.2 /100 | #73 | Exceptional 7.0% |
| Turks | 99.2 /100 | #74 | Exceptional 7.0% |
| Immigrants | Eastern Europe | 99.0 /100 | #75 | Exceptional 7.1% |
| Estonians | 99.0 /100 | #76 | Exceptional 7.1% |
| Immigrants | Croatia | 98.9 /100 | #77 | Exceptional 7.1% |
| Immigrants | Somalia | 98.9 /100 | #78 | Exceptional 7.1% |
| Immigrants | Fiji | 98.9 /100 | #79 | Exceptional 7.1% |
| Immigrants | Greece | 98.9 /100 | #80 | Exceptional 7.1% |
| Immigrants | Venezuela | 98.8 /100 | #81 | Exceptional 7.1% |
| Immigrants | Afghanistan | 98.7 /100 | #82 | Exceptional 7.1% |
| Egyptians | 98.7 /100 | #83 | Exceptional 7.1% |
| Immigrants | Albania | 98.7 /100 | #84 | Exceptional 7.1% |
| Immigrants | Romania | 98.7 /100 | #85 | Exceptional 7.1% |
| Immigrants | Zimbabwe | 98.6 /100 | #86 | Exceptional 7.1% |