Irish vs Soviet Union Unemployment Among Ages 65 to 74 years
COMPARE
Irish
Soviet Union
Unemployment Among Ages 65 to 74 years
Unemployment Among Ages 65 to 74 years Comparison
Irish
Soviet Union
5.3%
UNEMPLOYMENT AMONG AGES 65 TO 74 YEARS
74.8/ 100
METRIC RATING
146th/ 347
METRIC RANK
5.4%
UNEMPLOYMENT AMONG AGES 65 TO 74 YEARS
40.0/ 100
METRIC RATING
181st/ 347
METRIC RANK
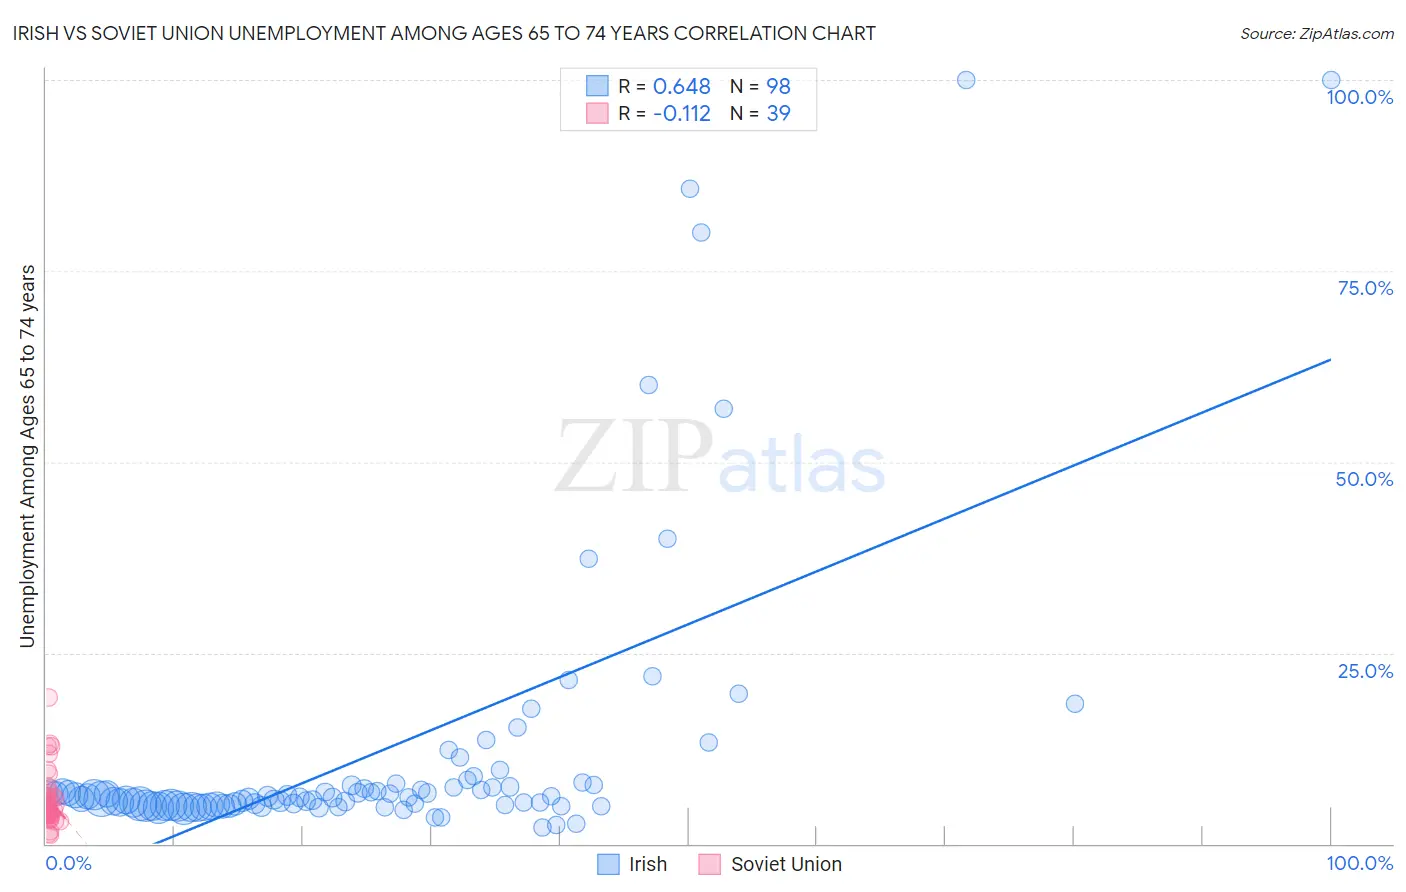
Irish vs Soviet Union Unemployment Among Ages 65 to 74 years Correlation Chart
The statistical analysis conducted on geographies consisting of 447,594,023 people shows a significant positive correlation between the proportion of Irish and unemployment rate among population between the ages 65 and 74 in the United States with a correlation coefficient (R) of 0.648 and weighted average of 5.3%. Similarly, the statistical analysis conducted on geographies consisting of 43,068,547 people shows a poor negative correlation between the proportion of Soviet Union and unemployment rate among population between the ages 65 and 74 in the United States with a correlation coefficient (R) of -0.112 and weighted average of 5.4%, a difference of 1.3%.
Unemployment Among Ages 65 to 74 years Correlation Summary
| Measurement | Irish | Soviet Union |
| Minimum | 2.1% | 1.2% |
| Maximum | 100.0% | 19.1% |
| Range | 97.9% | 17.9% |
| Mean | 12.1% | 5.9% |
| Median | 6.1% | 5.0% |
| Interquartile 25% (IQ1) | 5.1% | 3.8% |
| Interquartile 75% (IQ3) | 7.6% | 6.2% |
| Interquartile Range (IQR) | 2.5% | 2.5% |
| Standard Deviation (Sample) | 19.0% | 3.7% |
| Standard Deviation (Population) | 18.9% | 3.7% |
Similar Demographics by Unemployment Among Ages 65 to 74 years
Demographics Similar to Irish by Unemployment Among Ages 65 to 74 years
In terms of unemployment among ages 65 to 74 years, the demographic groups most similar to Irish are Canadian (5.3%, a difference of 0.010%), Immigrants from Latvia (5.3%, a difference of 0.010%), Immigrants from Sri Lanka (5.3%, a difference of 0.040%), Turkish (5.3%, a difference of 0.060%), and New Zealander (5.3%, a difference of 0.060%).
| Demographics | Rating | Rank | Unemployment Among Ages 65 to 74 years |
| Finns | 79.0 /100 | #139 | Good 5.3% |
| Immigrants | Laos | 78.6 /100 | #140 | Good 5.3% |
| Immigrants | Asia | 78.4 /100 | #141 | Good 5.3% |
| Turks | 76.2 /100 | #142 | Good 5.3% |
| New Zealanders | 76.1 /100 | #143 | Good 5.3% |
| Immigrants | Chile | 76.0 /100 | #144 | Good 5.3% |
| Canadians | 75.0 /100 | #145 | Good 5.3% |
| Irish | 74.8 /100 | #146 | Good 5.3% |
| Immigrants | Latvia | 74.6 /100 | #147 | Good 5.3% |
| Immigrants | Sri Lanka | 73.8 /100 | #148 | Good 5.3% |
| Immigrants | Romania | 73.5 /100 | #149 | Good 5.3% |
| Immigrants | Poland | 73.2 /100 | #150 | Good 5.3% |
| Immigrants | Indonesia | 72.9 /100 | #151 | Good 5.3% |
| Spanish | 72.6 /100 | #152 | Good 5.3% |
| Immigrants | Cabo Verde | 72.5 /100 | #153 | Good 5.3% |
Demographics Similar to Soviet Union by Unemployment Among Ages 65 to 74 years
In terms of unemployment among ages 65 to 74 years, the demographic groups most similar to Soviet Union are Spanish American (5.4%, a difference of 0.060%), Guamanian/Chamorro (5.4%, a difference of 0.070%), Immigrants from Ireland (5.4%, a difference of 0.070%), Immigrants from Spain (5.4%, a difference of 0.090%), and French (5.4%, a difference of 0.11%).
| Demographics | Rating | Rank | Unemployment Among Ages 65 to 74 years |
| Potawatomi | 50.0 /100 | #174 | Average 5.4% |
| Immigrants | Iran | 49.0 /100 | #175 | Average 5.4% |
| Immigrants | Western Europe | 47.3 /100 | #176 | Average 5.4% |
| Arabs | 46.8 /100 | #177 | Average 5.4% |
| French | 43.1 /100 | #178 | Average 5.4% |
| Guamanians/Chamorros | 42.1 /100 | #179 | Average 5.4% |
| Immigrants | Ireland | 42.0 /100 | #180 | Average 5.4% |
| Soviet Union | 40.0 /100 | #181 | Fair 5.4% |
| Spanish Americans | 38.2 /100 | #182 | Fair 5.4% |
| Immigrants | Spain | 37.3 /100 | #183 | Fair 5.4% |
| Immigrants | Senegal | 35.2 /100 | #184 | Fair 5.4% |
| Russians | 34.4 /100 | #185 | Fair 5.4% |
| Lithuanians | 32.4 /100 | #186 | Fair 5.4% |
| Immigrants | Nonimmigrants | 30.6 /100 | #187 | Fair 5.4% |
| Immigrants | Europe | 28.8 /100 | #188 | Fair 5.4% |