Guamanian/Chamorro vs Soviet Union Unemployment Among Ages 65 to 74 years
COMPARE
Guamanian/Chamorro
Soviet Union
Unemployment Among Ages 65 to 74 years
Unemployment Among Ages 65 to 74 years Comparison
Guamanians/Chamorros
Soviet Union
5.4%
UNEMPLOYMENT AMONG AGES 65 TO 74 YEARS
42.1/ 100
METRIC RATING
179th/ 347
METRIC RANK
5.4%
UNEMPLOYMENT AMONG AGES 65 TO 74 YEARS
40.0/ 100
METRIC RATING
181st/ 347
METRIC RANK
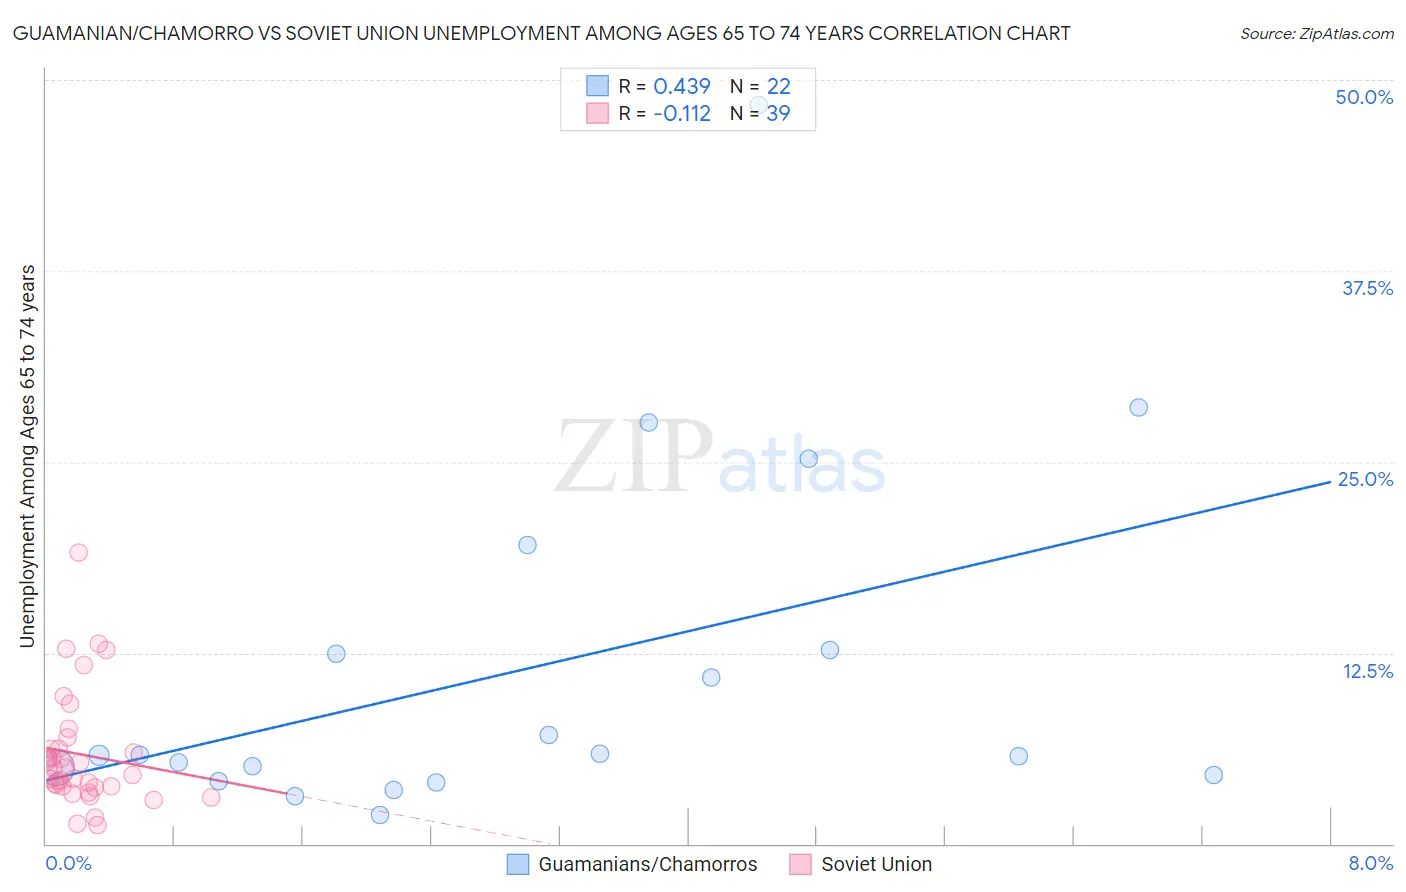
Guamanian/Chamorro vs Soviet Union Unemployment Among Ages 65 to 74 years Correlation Chart
The statistical analysis conducted on geographies consisting of 205,325,278 people shows a moderate positive correlation between the proportion of Guamanians/Chamorros and unemployment rate among population between the ages 65 and 74 in the United States with a correlation coefficient (R) of 0.439 and weighted average of 5.4%. Similarly, the statistical analysis conducted on geographies consisting of 43,068,547 people shows a poor negative correlation between the proportion of Soviet Union and unemployment rate among population between the ages 65 and 74 in the United States with a correlation coefficient (R) of -0.112 and weighted average of 5.4%, a difference of 0.070%.
Unemployment Among Ages 65 to 74 years Correlation Summary
| Measurement | Guamanian/Chamorro | Soviet Union |
| Minimum | 1.9% | 1.2% |
| Maximum | 48.4% | 19.1% |
| Range | 46.5% | 17.9% |
| Mean | 11.5% | 5.9% |
| Median | 5.8% | 5.0% |
| Interquartile 25% (IQ1) | 4.5% | 3.8% |
| Interquartile 75% (IQ3) | 12.7% | 6.2% |
| Interquartile Range (IQR) | 8.2% | 2.5% |
| Standard Deviation (Sample) | 11.6% | 3.7% |
| Standard Deviation (Population) | 11.3% | 3.7% |
Demographics Similar to Guamanians/Chamorros and Soviet Union by Unemployment Among Ages 65 to 74 years
In terms of unemployment among ages 65 to 74 years, the demographic groups most similar to Guamanians/Chamorros are Immigrants from Ireland (5.4%, a difference of 0.0%), French (5.4%, a difference of 0.030%), Spanish American (5.4%, a difference of 0.14%), Arab (5.4%, a difference of 0.16%), and Immigrants from Western Europe (5.4%, a difference of 0.17%). Similarly, the demographic groups most similar to Soviet Union are Spanish American (5.4%, a difference of 0.060%), Immigrants from Ireland (5.4%, a difference of 0.070%), Immigrants from Spain (5.4%, a difference of 0.090%), French (5.4%, a difference of 0.11%), and Immigrants from Senegal (5.4%, a difference of 0.17%).
| Demographics | Rating | Rank | Unemployment Among Ages 65 to 74 years |
| Syrians | 53.7 /100 | #170 | Average 5.4% |
| Panamanians | 51.8 /100 | #171 | Average 5.4% |
| Greeks | 51.1 /100 | #172 | Average 5.4% |
| Immigrants | Northern Europe | 51.1 /100 | #173 | Average 5.4% |
| Potawatomi | 50.0 /100 | #174 | Average 5.4% |
| Immigrants | Iran | 49.0 /100 | #175 | Average 5.4% |
| Immigrants | Western Europe | 47.3 /100 | #176 | Average 5.4% |
| Arabs | 46.8 /100 | #177 | Average 5.4% |
| French | 43.1 /100 | #178 | Average 5.4% |
| Guamanians/Chamorros | 42.1 /100 | #179 | Average 5.4% |
| Immigrants | Ireland | 42.0 /100 | #180 | Average 5.4% |
| Soviet Union | 40.0 /100 | #181 | Fair 5.4% |
| Spanish Americans | 38.2 /100 | #182 | Fair 5.4% |
| Immigrants | Spain | 37.3 /100 | #183 | Fair 5.4% |
| Immigrants | Senegal | 35.2 /100 | #184 | Fair 5.4% |
| Russians | 34.4 /100 | #185 | Fair 5.4% |
| Lithuanians | 32.4 /100 | #186 | Fair 5.4% |
| Immigrants | Nonimmigrants | 30.6 /100 | #187 | Fair 5.4% |
| Immigrants | Europe | 28.8 /100 | #188 | Fair 5.4% |
| Immigrants | Africa | 28.3 /100 | #189 | Fair 5.4% |
| Basques | 26.6 /100 | #190 | Fair 5.4% |