Immigrants from China vs Soviet Union Unemployment Among Ages 65 to 74 years
COMPARE
Immigrants from China
Soviet Union
Unemployment Among Ages 65 to 74 years
Unemployment Among Ages 65 to 74 years Comparison
Immigrants from China
Soviet Union
5.4%
UNEMPLOYMENT AMONG AGES 65 TO 74 YEARS
24.2/ 100
METRIC RATING
195th/ 347
METRIC RANK
5.4%
UNEMPLOYMENT AMONG AGES 65 TO 74 YEARS
40.0/ 100
METRIC RATING
181st/ 347
METRIC RANK
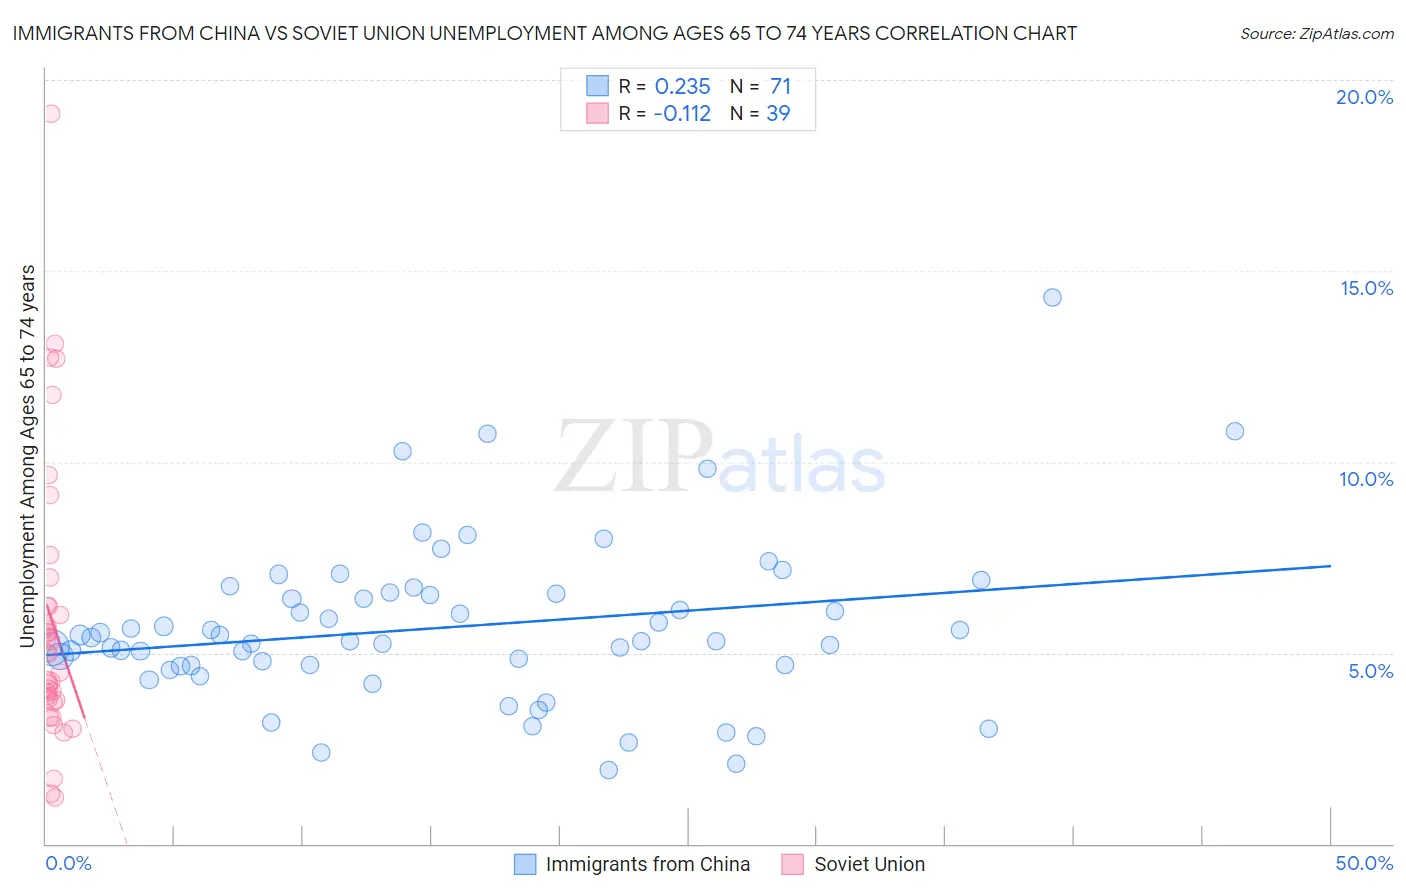
Immigrants from China vs Soviet Union Unemployment Among Ages 65 to 74 years Correlation Chart
The statistical analysis conducted on geographies consisting of 393,737,686 people shows a weak positive correlation between the proportion of Immigrants from China and unemployment rate among population between the ages 65 and 74 in the United States with a correlation coefficient (R) of 0.235 and weighted average of 5.4%. Similarly, the statistical analysis conducted on geographies consisting of 43,068,547 people shows a poor negative correlation between the proportion of Soviet Union and unemployment rate among population between the ages 65 and 74 in the United States with a correlation coefficient (R) of -0.112 and weighted average of 5.4%, a difference of 0.61%.
Unemployment Among Ages 65 to 74 years Correlation Summary
| Measurement | Immigrants from China | Soviet Union |
| Minimum | 1.9% | 1.2% |
| Maximum | 14.3% | 19.1% |
| Range | 12.4% | 17.9% |
| Mean | 5.7% | 5.9% |
| Median | 5.3% | 5.0% |
| Interquartile 25% (IQ1) | 4.7% | 3.8% |
| Interquartile 75% (IQ3) | 6.5% | 6.2% |
| Interquartile Range (IQR) | 1.9% | 2.5% |
| Standard Deviation (Sample) | 2.1% | 3.7% |
| Standard Deviation (Population) | 2.1% | 3.7% |
Demographics Similar to Immigrants from China and Soviet Union by Unemployment Among Ages 65 to 74 years
In terms of unemployment among ages 65 to 74 years, the demographic groups most similar to Immigrants from China are Immigrants from Denmark (5.4%, a difference of 0.020%), Cherokee (5.4%, a difference of 0.070%), Immigrants from Egypt (5.4%, a difference of 0.10%), Maltese (5.4%, a difference of 0.10%), and Basque (5.4%, a difference of 0.11%). Similarly, the demographic groups most similar to Soviet Union are Spanish American (5.4%, a difference of 0.060%), Guamanian/Chamorro (5.4%, a difference of 0.070%), Immigrants from Ireland (5.4%, a difference of 0.070%), Immigrants from Spain (5.4%, a difference of 0.090%), and French (5.4%, a difference of 0.11%).
| Demographics | Rating | Rank | Unemployment Among Ages 65 to 74 years |
| French | 43.1 /100 | #178 | Average 5.4% |
| Guamanians/Chamorros | 42.1 /100 | #179 | Average 5.4% |
| Immigrants | Ireland | 42.0 /100 | #180 | Average 5.4% |
| Soviet Union | 40.0 /100 | #181 | Fair 5.4% |
| Spanish Americans | 38.2 /100 | #182 | Fair 5.4% |
| Immigrants | Spain | 37.3 /100 | #183 | Fair 5.4% |
| Immigrants | Senegal | 35.2 /100 | #184 | Fair 5.4% |
| Russians | 34.4 /100 | #185 | Fair 5.4% |
| Lithuanians | 32.4 /100 | #186 | Fair 5.4% |
| Immigrants | Nonimmigrants | 30.6 /100 | #187 | Fair 5.4% |
| Immigrants | Europe | 28.8 /100 | #188 | Fair 5.4% |
| Immigrants | Africa | 28.3 /100 | #189 | Fair 5.4% |
| Basques | 26.6 /100 | #190 | Fair 5.4% |
| Immigrants | Egypt | 26.5 /100 | #191 | Fair 5.4% |
| Maltese | 26.4 /100 | #192 | Fair 5.4% |
| Cherokee | 25.8 /100 | #193 | Fair 5.4% |
| Immigrants | Denmark | 24.7 /100 | #194 | Fair 5.4% |
| Immigrants | China | 24.2 /100 | #195 | Fair 5.4% |
| Costa Ricans | 21.1 /100 | #196 | Fair 5.4% |
| Colville | 20.4 /100 | #197 | Fair 5.4% |
| Albanians | 17.8 /100 | #198 | Poor 5.4% |