Iranian vs Maltese Unemployment Among Ages 30 to 34 years
COMPARE
Iranian
Maltese
Unemployment Among Ages 30 to 34 years
Unemployment Among Ages 30 to 34 years Comparison
Iranians
Maltese
5.2%
UNEMPLOYMENT AMONG AGES 30 TO 34 YEARS
96.0/ 100
METRIC RATING
75th/ 347
METRIC RANK
5.2%
UNEMPLOYMENT AMONG AGES 30 TO 34 YEARS
92.3/ 100
METRIC RATING
94th/ 347
METRIC RANK
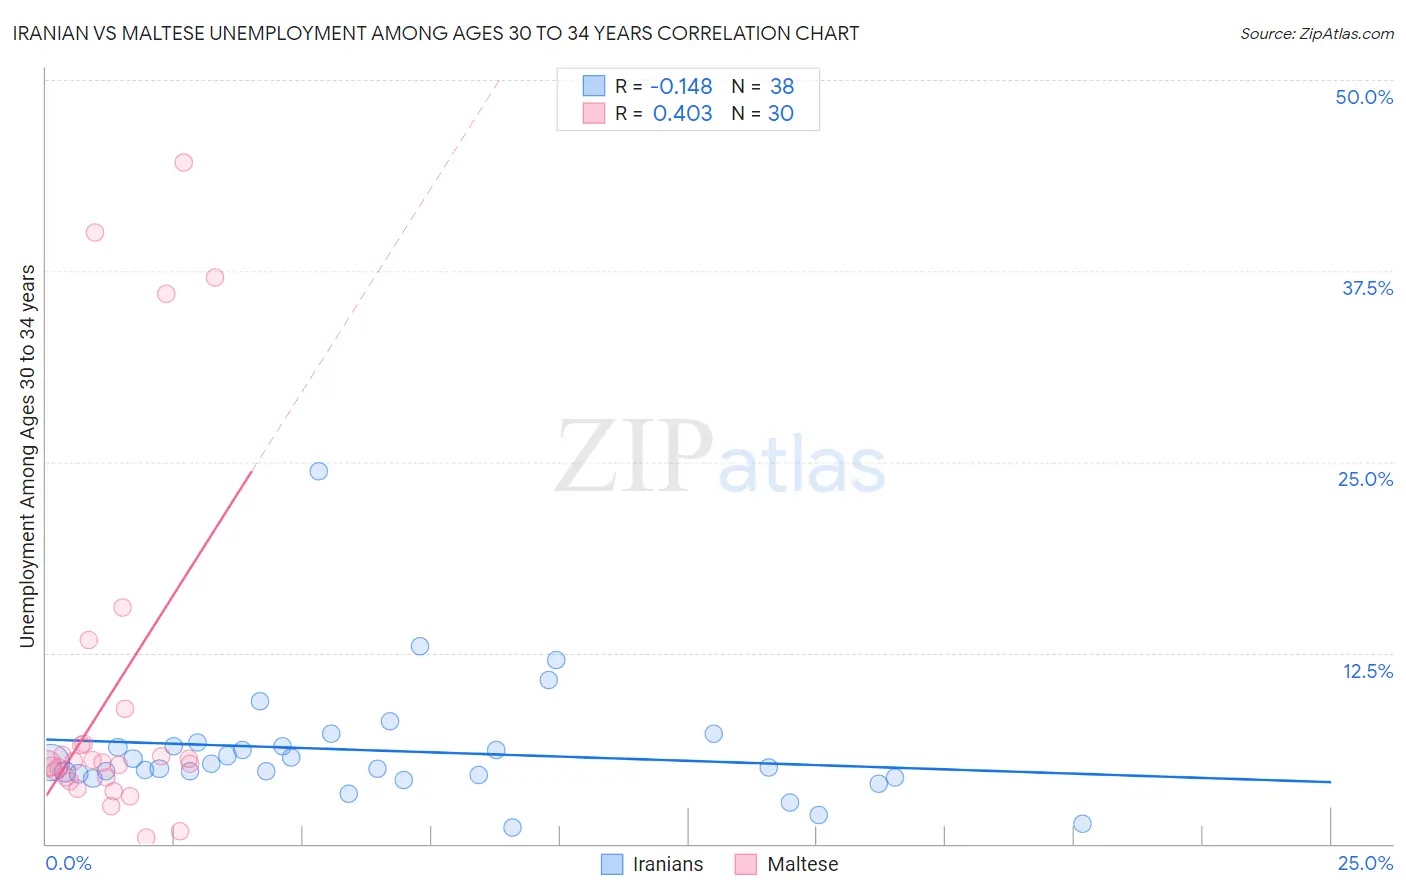
Iranian vs Maltese Unemployment Among Ages 30 to 34 years Correlation Chart
The statistical analysis conducted on geographies consisting of 304,439,864 people shows a poor negative correlation between the proportion of Iranians and unemployment rate among population between the ages 30 and 34 in the United States with a correlation coefficient (R) of -0.148 and weighted average of 5.2%. Similarly, the statistical analysis conducted on geographies consisting of 123,021,177 people shows a moderate positive correlation between the proportion of Maltese and unemployment rate among population between the ages 30 and 34 in the United States with a correlation coefficient (R) of 0.403 and weighted average of 5.2%, a difference of 1.3%.
Unemployment Among Ages 30 to 34 years Correlation Summary
| Measurement | Iranian | Maltese |
| Minimum | 1.1% | 0.40% |
| Maximum | 24.4% | 44.6% |
| Range | 23.3% | 44.2% |
| Mean | 6.1% | 10.0% |
| Median | 5.1% | 5.3% |
| Interquartile 25% (IQ1) | 4.5% | 4.3% |
| Interquartile 75% (IQ3) | 6.4% | 6.6% |
| Interquartile Range (IQR) | 1.9% | 2.2% |
| Standard Deviation (Sample) | 3.9% | 12.2% |
| Standard Deviation (Population) | 3.9% | 12.0% |
Demographics Similar to Iranians and Maltese by Unemployment Among Ages 30 to 34 years
In terms of unemployment among ages 30 to 34 years, the demographic groups most similar to Iranians are Immigrants from Asia (5.2%, a difference of 0.060%), Scandinavian (5.2%, a difference of 0.21%), Uruguayan (5.2%, a difference of 0.28%), Indonesian (5.2%, a difference of 0.41%), and Immigrants from Lithuania (5.2%, a difference of 0.46%). Similarly, the demographic groups most similar to Maltese are Laotian (5.2%, a difference of 0.0%), Immigrants from Argentina (5.2%, a difference of 0.050%), Iraqi (5.2%, a difference of 0.070%), Immigrants from Romania (5.2%, a difference of 0.12%), and Immigrants from Sweden (5.2%, a difference of 0.27%).
| Demographics | Rating | Rank | Unemployment Among Ages 30 to 34 years |
| Immigrants | Asia | 96.2 /100 | #74 | Exceptional 5.2% |
| Iranians | 96.0 /100 | #75 | Exceptional 5.2% |
| Scandinavians | 95.6 /100 | #76 | Exceptional 5.2% |
| Uruguayans | 95.4 /100 | #77 | Exceptional 5.2% |
| Indonesians | 95.1 /100 | #78 | Exceptional 5.2% |
| Immigrants | Lithuania | 95.0 /100 | #79 | Exceptional 5.2% |
| Immigrants | Indonesia | 94.7 /100 | #80 | Exceptional 5.2% |
| Chileans | 94.4 /100 | #81 | Exceptional 5.2% |
| Immigrants | Latvia | 94.2 /100 | #82 | Exceptional 5.2% |
| Immigrants | Korea | 94.1 /100 | #83 | Exceptional 5.2% |
| Immigrants | Uganda | 94.0 /100 | #84 | Exceptional 5.2% |
| Immigrants | Egypt | 93.9 /100 | #85 | Exceptional 5.2% |
| Immigrants | Australia | 93.5 /100 | #86 | Exceptional 5.2% |
| Bhutanese | 93.5 /100 | #87 | Exceptional 5.2% |
| Immigrants | Kenya | 93.3 /100 | #88 | Exceptional 5.2% |
| Immigrants | Sweden | 93.3 /100 | #89 | Exceptional 5.2% |
| Immigrants | Romania | 92.8 /100 | #90 | Exceptional 5.2% |
| Iraqis | 92.6 /100 | #91 | Exceptional 5.2% |
| Immigrants | Argentina | 92.5 /100 | #92 | Exceptional 5.2% |
| Laotians | 92.4 /100 | #93 | Exceptional 5.2% |
| Maltese | 92.3 /100 | #94 | Exceptional 5.2% |