Samoan vs Northern European Unemployment Among Ages 25 to 29 years
COMPARE
Samoan
Northern European
Unemployment Among Ages 25 to 29 years
Unemployment Among Ages 25 to 29 years Comparison
Samoans
Northern Europeans
6.6%
UNEMPLOYMENT AMONG AGES 25 TO 29 YEARS
64.6/ 100
METRIC RATING
152nd/ 347
METRIC RANK
6.5%
UNEMPLOYMENT AMONG AGES 25 TO 29 YEARS
75.4/ 100
METRIC RATING
136th/ 347
METRIC RANK
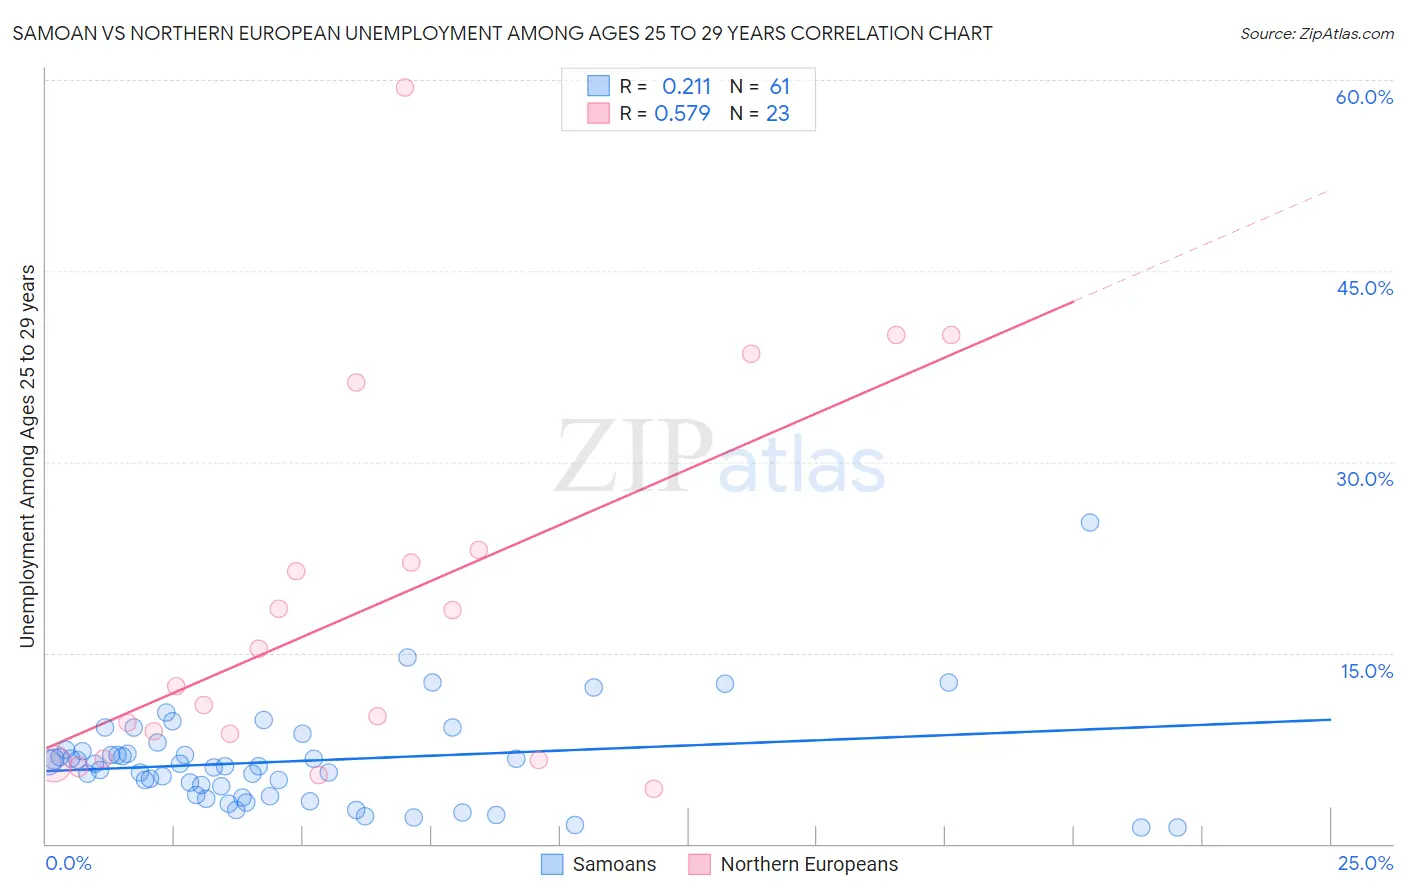
Samoan vs Northern European Unemployment Among Ages 25 to 29 years Correlation Chart
The statistical analysis conducted on geographies consisting of 219,635,953 people shows a weak positive correlation between the proportion of Samoans and unemployment rate among population between the ages 25 and 29 in the United States with a correlation coefficient (R) of 0.211 and weighted average of 6.6%. Similarly, the statistical analysis conducted on geographies consisting of 379,973,816 people shows a substantial positive correlation between the proportion of Northern Europeans and unemployment rate among population between the ages 25 and 29 in the United States with a correlation coefficient (R) of 0.579 and weighted average of 6.5%, a difference of 0.81%.
Unemployment Among Ages 25 to 29 years Correlation Summary
| Measurement | Samoan | Northern European |
| Minimum | 1.3% | 4.3% |
| Maximum | 25.2% | 59.4% |
| Range | 23.9% | 55.1% |
| Mean | 6.5% | 18.6% |
| Median | 6.1% | 12.3% |
| Interquartile 25% (IQ1) | 3.8% | 6.7% |
| Interquartile 75% (IQ3) | 7.3% | 23.1% |
| Interquartile Range (IQR) | 3.6% | 16.4% |
| Standard Deviation (Sample) | 3.9% | 14.7% |
| Standard Deviation (Population) | 3.8% | 14.4% |
Demographics Similar to Samoans and Northern Europeans by Unemployment Among Ages 25 to 29 years
In terms of unemployment among ages 25 to 29 years, the demographic groups most similar to Samoans are Immigrants from Italy (6.6%, a difference of 0.020%), Colombian (6.6%, a difference of 0.040%), Ukrainian (6.6%, a difference of 0.060%), Finnish (6.6%, a difference of 0.16%), and Malaysian (6.6%, a difference of 0.17%). Similarly, the demographic groups most similar to Northern Europeans are Immigrants from Croatia (6.5%, a difference of 0.010%), Immigrants from Vietnam (6.5%, a difference of 0.020%), Eastern European (6.5%, a difference of 0.11%), Immigrants from Belgium (6.5%, a difference of 0.13%), and Austrian (6.5%, a difference of 0.13%).
| Demographics | Rating | Rank | Unemployment Among Ages 25 to 29 years |
| Immigrants | Vietnam | 75.6 /100 | #134 | Good 6.5% |
| Immigrants | Croatia | 75.5 /100 | #135 | Good 6.5% |
| Northern Europeans | 75.4 /100 | #136 | Good 6.5% |
| Eastern Europeans | 74.1 /100 | #137 | Good 6.5% |
| Immigrants | Belgium | 73.8 /100 | #138 | Good 6.5% |
| Austrians | 73.8 /100 | #139 | Good 6.5% |
| Immigrants | Pakistan | 73.8 /100 | #140 | Good 6.5% |
| Maltese | 72.9 /100 | #141 | Good 6.5% |
| Slavs | 72.5 /100 | #142 | Good 6.5% |
| Lithuanians | 72.2 /100 | #143 | Good 6.5% |
| Immigrants | Micronesia | 71.5 /100 | #144 | Good 6.6% |
| Nicaraguans | 70.2 /100 | #145 | Good 6.6% |
| Romanians | 69.5 /100 | #146 | Good 6.6% |
| Immigrants | Thailand | 68.4 /100 | #147 | Good 6.6% |
| Peruvians | 68.1 /100 | #148 | Good 6.6% |
| Malaysians | 67.1 /100 | #149 | Good 6.6% |
| Finns | 66.9 /100 | #150 | Good 6.6% |
| Ukrainians | 65.5 /100 | #151 | Good 6.6% |
| Samoans | 64.6 /100 | #152 | Good 6.6% |
| Immigrants | Italy | 64.4 /100 | #153 | Good 6.6% |
| Colombians | 64.0 /100 | #154 | Good 6.6% |