Inupiat vs Okinawan Unemployment Among Seniors over 65 years
COMPARE
Inupiat
Okinawan
Unemployment Among Seniors over 65 years
Unemployment Among Seniors over 65 years Comparison
Inupiat
Okinawans
5.8%
UNEMPLOYMENT AMONG SENIORS OVER 65 YEARS
0.0/ 100
METRIC RATING
325th/ 347
METRIC RANK
5.0%
UNEMPLOYMENT AMONG SENIORS OVER 65 YEARS
94.7/ 100
METRIC RATING
105th/ 347
METRIC RANK
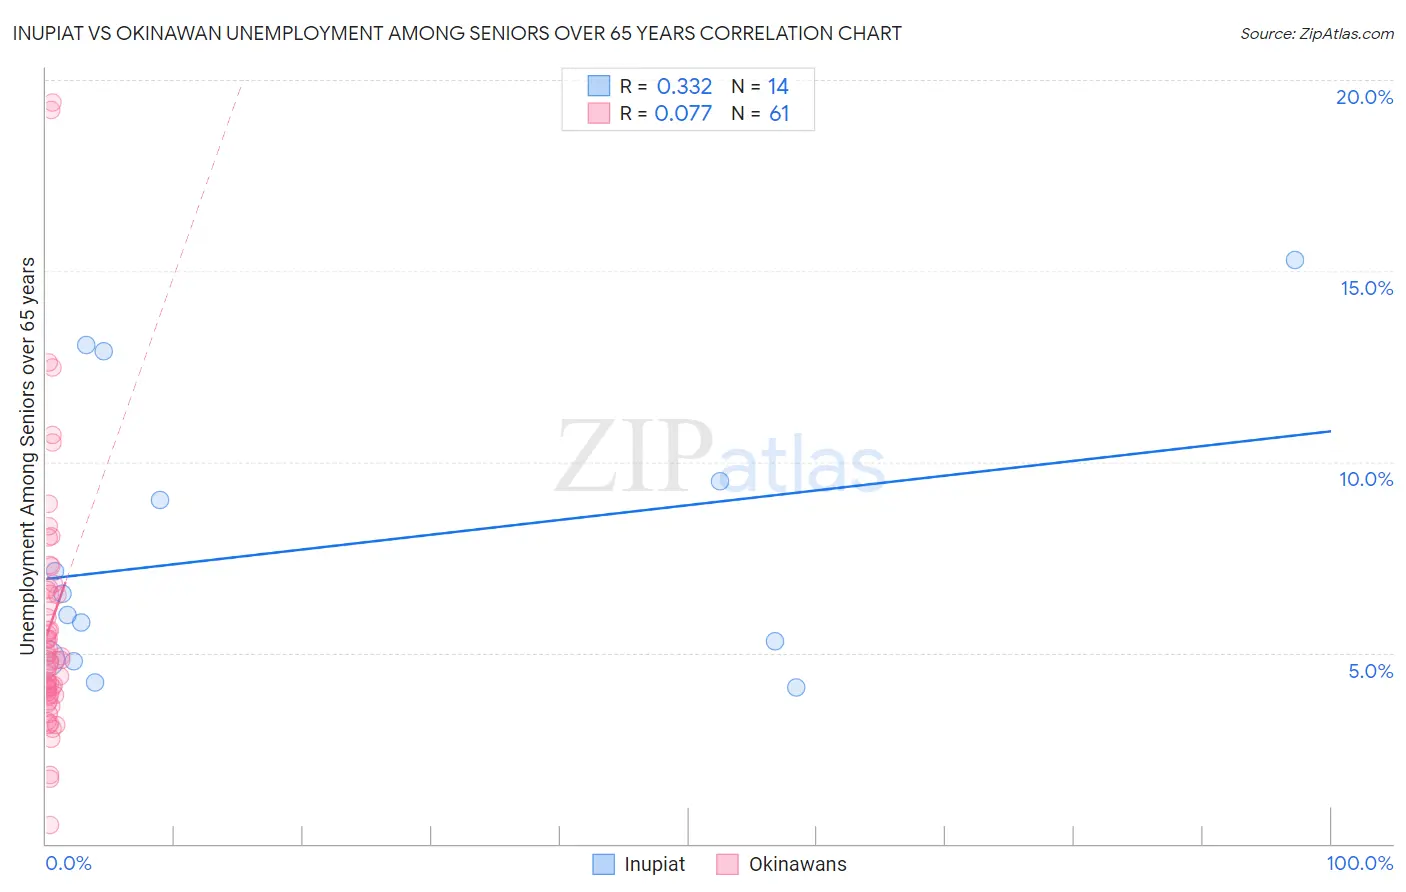
Inupiat vs Okinawan Unemployment Among Seniors over 65 years Correlation Chart
The statistical analysis conducted on geographies consisting of 92,385,648 people shows a mild positive correlation between the proportion of Inupiat and unemployment rate amomg seniors over the age of 65 in the United States with a correlation coefficient (R) of 0.332 and weighted average of 5.8%. Similarly, the statistical analysis conducted on geographies consisting of 72,306,358 people shows a slight positive correlation between the proportion of Okinawans and unemployment rate amomg seniors over the age of 65 in the United States with a correlation coefficient (R) of 0.077 and weighted average of 5.0%, a difference of 16.0%.
Unemployment Among Seniors over 65 years Correlation Summary
| Measurement | Inupiat | Okinawan |
| Minimum | 4.1% | 0.50% |
| Maximum | 15.3% | 19.4% |
| Range | 11.2% | 18.9% |
| Mean | 7.7% | 5.7% |
| Median | 6.3% | 4.8% |
| Interquartile 25% (IQ1) | 4.8% | 3.9% |
| Interquartile 75% (IQ3) | 9.5% | 6.6% |
| Interquartile Range (IQR) | 4.7% | 2.7% |
| Standard Deviation (Sample) | 3.7% | 3.4% |
| Standard Deviation (Population) | 3.5% | 3.4% |
Similar Demographics by Unemployment Among Seniors over 65 years
Demographics Similar to Inupiat by Unemployment Among Seniors over 65 years
In terms of unemployment among seniors over 65 years, the demographic groups most similar to Inupiat are Shoshone (5.9%, a difference of 0.43%), Yuman (5.8%, a difference of 0.57%), Immigrants from Dominica (5.8%, a difference of 0.75%), Bermudan (5.9%, a difference of 0.91%), and Native/Alaskan (5.8%, a difference of 1.1%).
| Demographics | Rating | Rank | Unemployment Among Seniors over 65 years |
| Vietnamese | 0.0 /100 | #318 | Tragic 5.7% |
| Immigrants | Bangladesh | 0.0 /100 | #319 | Tragic 5.7% |
| Immigrants | Mexico | 0.0 /100 | #320 | Tragic 5.7% |
| British West Indians | 0.0 /100 | #321 | Tragic 5.8% |
| Natives/Alaskans | 0.0 /100 | #322 | Tragic 5.8% |
| Immigrants | Dominica | 0.0 /100 | #323 | Tragic 5.8% |
| Yuman | 0.0 /100 | #324 | Tragic 5.8% |
| Inupiat | 0.0 /100 | #325 | Tragic 5.8% |
| Shoshone | 0.0 /100 | #326 | Tragic 5.9% |
| Bermudans | 0.0 /100 | #327 | Tragic 5.9% |
| Puerto Ricans | 0.0 /100 | #328 | Tragic 5.9% |
| Dominicans | 0.0 /100 | #329 | Tragic 6.0% |
| Immigrants | Portugal | 0.0 /100 | #330 | Tragic 6.0% |
| Taiwanese | 0.0 /100 | #331 | Tragic 6.0% |
| Aleuts | 0.0 /100 | #332 | Tragic 6.0% |
Demographics Similar to Okinawans by Unemployment Among Seniors over 65 years
In terms of unemployment among seniors over 65 years, the demographic groups most similar to Okinawans are Immigrants from Scotland (5.0%, a difference of 0.050%), Immigrants from Turkey (5.0%, a difference of 0.060%), Immigrants from Lithuania (5.0%, a difference of 0.070%), Immigrants from Thailand (5.0%, a difference of 0.12%), and Yugoslavian (5.0%, a difference of 0.13%).
| Demographics | Rating | Rank | Unemployment Among Seniors over 65 years |
| Czechoslovakians | 96.7 /100 | #98 | Exceptional 5.0% |
| South Africans | 96.5 /100 | #99 | Exceptional 5.0% |
| Romanians | 95.5 /100 | #100 | Exceptional 5.0% |
| Yugoslavians | 95.4 /100 | #101 | Exceptional 5.0% |
| Immigrants | Thailand | 95.4 /100 | #102 | Exceptional 5.0% |
| Immigrants | Lithuania | 95.1 /100 | #103 | Exceptional 5.0% |
| Immigrants | Scotland | 95.0 /100 | #104 | Exceptional 5.0% |
| Okinawans | 94.7 /100 | #105 | Exceptional 5.0% |
| Immigrants | Turkey | 94.3 /100 | #106 | Exceptional 5.0% |
| Immigrants | Germany | 93.2 /100 | #107 | Exceptional 5.0% |
| Immigrants | Vietnam | 92.9 /100 | #108 | Exceptional 5.0% |
| Immigrants | Malaysia | 92.7 /100 | #109 | Exceptional 5.0% |
| Immigrants | Saudi Arabia | 92.7 /100 | #110 | Exceptional 5.0% |
| Finns | 92.2 /100 | #111 | Exceptional 5.0% |
| Eastern Europeans | 92.0 /100 | #112 | Exceptional 5.0% |