Inupiat vs Potawatomi Unemployment Among Seniors over 65 years
COMPARE
Inupiat
Potawatomi
Unemployment Among Seniors over 65 years
Unemployment Among Seniors over 65 years Comparison
Inupiat
Potawatomi
5.8%
UNEMPLOYMENT AMONG SENIORS OVER 65 YEARS
0.0/ 100
METRIC RATING
325th/ 347
METRIC RANK
5.1%
UNEMPLOYMENT AMONG SENIORS OVER 65 YEARS
64.5/ 100
METRIC RATING
163rd/ 347
METRIC RANK
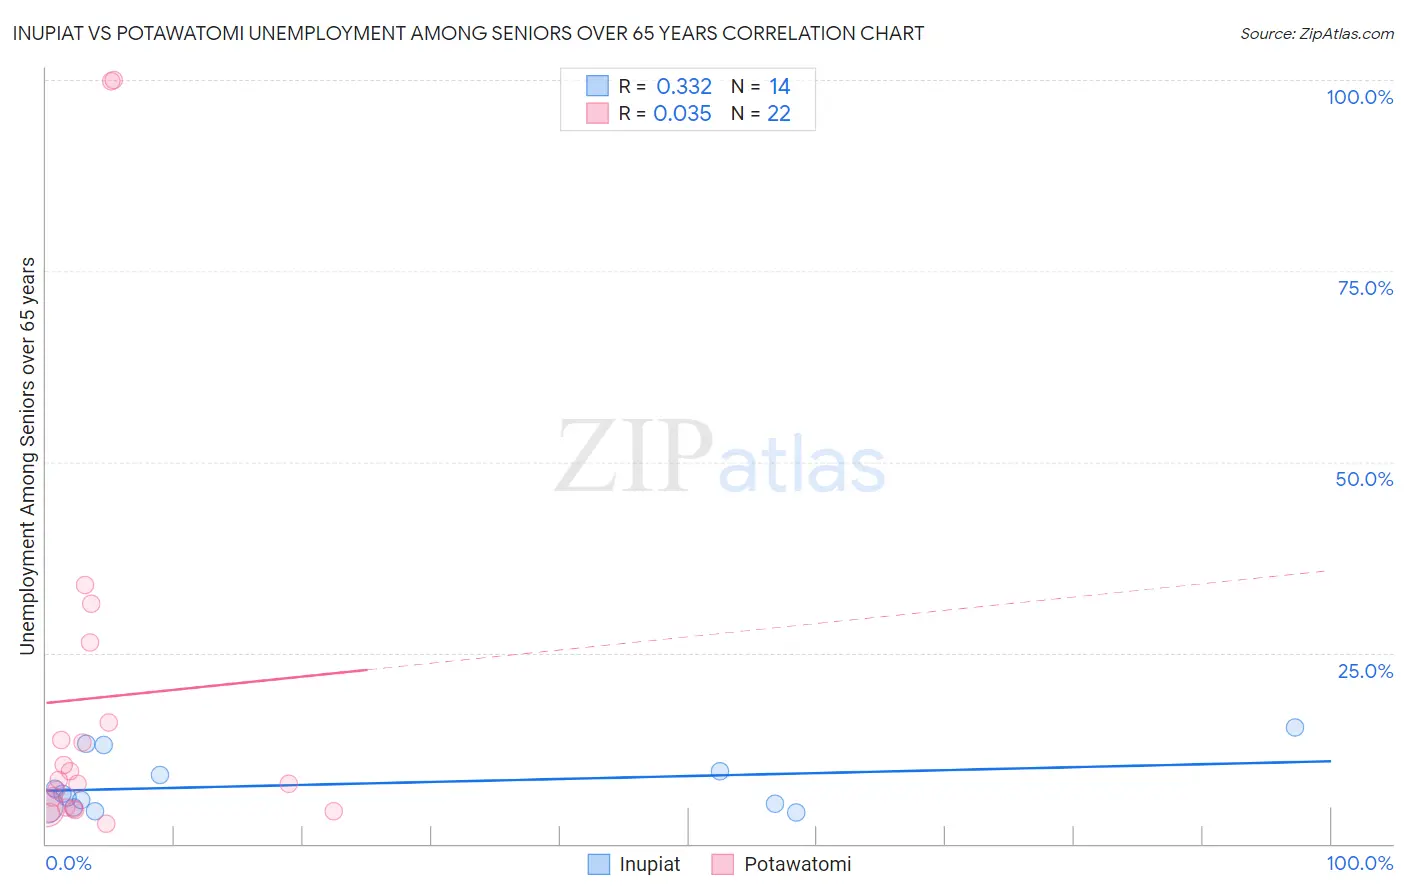
Inupiat vs Potawatomi Unemployment Among Seniors over 65 years Correlation Chart
The statistical analysis conducted on geographies consisting of 92,385,648 people shows a mild positive correlation between the proportion of Inupiat and unemployment rate amomg seniors over the age of 65 in the United States with a correlation coefficient (R) of 0.332 and weighted average of 5.8%. Similarly, the statistical analysis conducted on geographies consisting of 110,643,653 people shows no correlation between the proportion of Potawatomi and unemployment rate amomg seniors over the age of 65 in the United States with a correlation coefficient (R) of 0.035 and weighted average of 5.1%, a difference of 13.9%.
Unemployment Among Seniors over 65 years Correlation Summary
| Measurement | Inupiat | Potawatomi |
| Minimum | 4.1% | 2.7% |
| Maximum | 15.3% | 100.0% |
| Range | 11.2% | 97.3% |
| Mean | 7.7% | 19.1% |
| Median | 6.3% | 8.1% |
| Interquartile 25% (IQ1) | 4.8% | 4.6% |
| Interquartile 75% (IQ3) | 9.5% | 15.9% |
| Interquartile Range (IQR) | 4.7% | 11.3% |
| Standard Deviation (Sample) | 3.7% | 27.6% |
| Standard Deviation (Population) | 3.5% | 26.9% |
Similar Demographics by Unemployment Among Seniors over 65 years
Demographics Similar to Inupiat by Unemployment Among Seniors over 65 years
In terms of unemployment among seniors over 65 years, the demographic groups most similar to Inupiat are Shoshone (5.9%, a difference of 0.43%), Yuman (5.8%, a difference of 0.57%), Immigrants from Dominica (5.8%, a difference of 0.75%), Bermudan (5.9%, a difference of 0.91%), and Native/Alaskan (5.8%, a difference of 1.1%).
| Demographics | Rating | Rank | Unemployment Among Seniors over 65 years |
| Vietnamese | 0.0 /100 | #318 | Tragic 5.7% |
| Immigrants | Bangladesh | 0.0 /100 | #319 | Tragic 5.7% |
| Immigrants | Mexico | 0.0 /100 | #320 | Tragic 5.7% |
| British West Indians | 0.0 /100 | #321 | Tragic 5.8% |
| Natives/Alaskans | 0.0 /100 | #322 | Tragic 5.8% |
| Immigrants | Dominica | 0.0 /100 | #323 | Tragic 5.8% |
| Yuman | 0.0 /100 | #324 | Tragic 5.8% |
| Inupiat | 0.0 /100 | #325 | Tragic 5.8% |
| Shoshone | 0.0 /100 | #326 | Tragic 5.9% |
| Bermudans | 0.0 /100 | #327 | Tragic 5.9% |
| Puerto Ricans | 0.0 /100 | #328 | Tragic 5.9% |
| Dominicans | 0.0 /100 | #329 | Tragic 6.0% |
| Immigrants | Portugal | 0.0 /100 | #330 | Tragic 6.0% |
| Taiwanese | 0.0 /100 | #331 | Tragic 6.0% |
| Aleuts | 0.0 /100 | #332 | Tragic 6.0% |
Demographics Similar to Potawatomi by Unemployment Among Seniors over 65 years
In terms of unemployment among seniors over 65 years, the demographic groups most similar to Potawatomi are Nepalese (5.1%, a difference of 0.0%), Immigrants from Ukraine (5.1%, a difference of 0.010%), Immigrants from Laos (5.1%, a difference of 0.020%), Immigrants from South Eastern Asia (5.1%, a difference of 0.040%), and Immigrants from Bosnia and Herzegovina (5.1%, a difference of 0.060%).
| Demographics | Rating | Rank | Unemployment Among Seniors over 65 years |
| Immigrants | Romania | 72.4 /100 | #156 | Good 5.1% |
| Immigrants | Northern Europe | 69.8 /100 | #157 | Good 5.1% |
| Immigrants | Belarus | 69.0 /100 | #158 | Good 5.1% |
| Immigrants | France | 68.6 /100 | #159 | Good 5.1% |
| French | 68.1 /100 | #160 | Good 5.1% |
| Immigrants | Bosnia and Herzegovina | 66.1 /100 | #161 | Good 5.1% |
| Immigrants | South Eastern Asia | 65.6 /100 | #162 | Good 5.1% |
| Potawatomi | 64.5 /100 | #163 | Good 5.1% |
| Nepalese | 64.5 /100 | #164 | Good 5.1% |
| Immigrants | Ukraine | 64.2 /100 | #165 | Good 5.1% |
| Immigrants | Laos | 63.8 /100 | #166 | Good 5.1% |
| Immigrants | Western Europe | 60.4 /100 | #167 | Good 5.1% |
| Mongolians | 59.8 /100 | #168 | Average 5.1% |
| Lithuanians | 58.2 /100 | #169 | Average 5.1% |
| Immigrants | Eastern Asia | 54.9 /100 | #170 | Average 5.1% |