Inupiat vs Marshallese Unemployment Among Ages 65 to 74 years
COMPARE
Inupiat
Marshallese
Unemployment Among Ages 65 to 74 years
Unemployment Among Ages 65 to 74 years Comparison
Inupiat
Marshallese
7.5%
UNEMPLOYMENT AMONG AGES 65 TO 74 YEARS
0.0/ 100
METRIC RATING
344th/ 347
METRIC RANK
5.7%
UNEMPLOYMENT AMONG AGES 65 TO 74 YEARS
0.1/ 100
METRIC RATING
286th/ 347
METRIC RANK
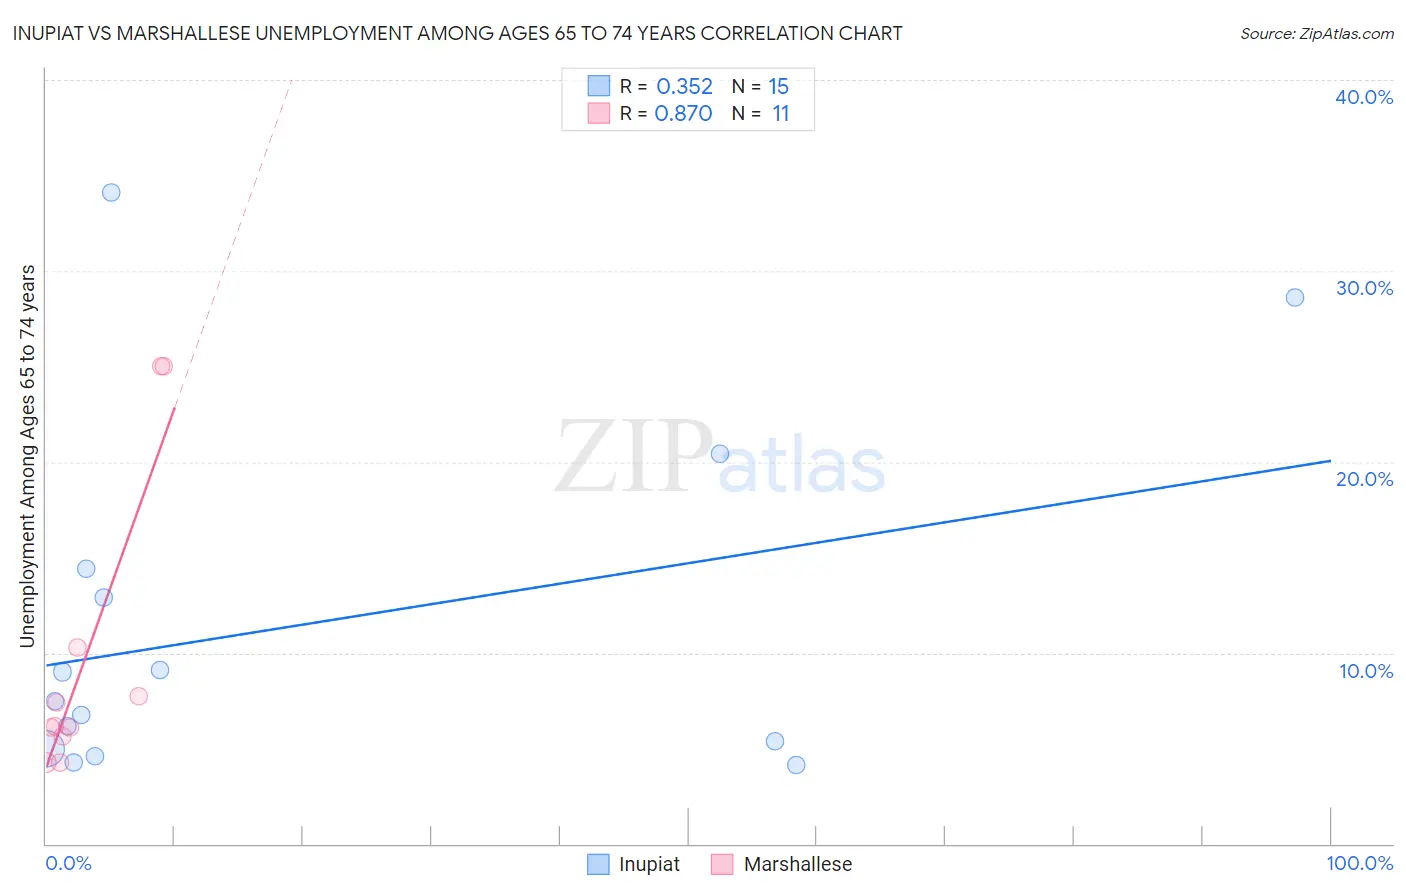
Inupiat vs Marshallese Unemployment Among Ages 65 to 74 years Correlation Chart
The statistical analysis conducted on geographies consisting of 91,705,326 people shows a mild positive correlation between the proportion of Inupiat and unemployment rate among population between the ages 65 and 74 in the United States with a correlation coefficient (R) of 0.352 and weighted average of 7.5%. Similarly, the statistical analysis conducted on geographies consisting of 14,110,955 people shows a very strong positive correlation between the proportion of Marshallese and unemployment rate among population between the ages 65 and 74 in the United States with a correlation coefficient (R) of 0.870 and weighted average of 5.7%, a difference of 31.4%.
Unemployment Among Ages 65 to 74 years Correlation Summary
| Measurement | Inupiat | Marshallese |
| Minimum | 4.1% | 4.2% |
| Maximum | 34.1% | 25.0% |
| Range | 30.0% | 20.8% |
| Mean | 11.5% | 9.8% |
| Median | 7.5% | 6.2% |
| Interquartile 25% (IQ1) | 5.0% | 5.6% |
| Interquartile 75% (IQ3) | 14.4% | 10.3% |
| Interquartile Range (IQR) | 9.4% | 4.7% |
| Standard Deviation (Sample) | 9.3% | 7.7% |
| Standard Deviation (Population) | 9.0% | 7.3% |
Similar Demographics by Unemployment Among Ages 65 to 74 years
Demographics Similar to Inupiat by Unemployment Among Ages 65 to 74 years
In terms of unemployment among ages 65 to 74 years, the demographic groups most similar to Inupiat are Alaskan Athabascan (7.4%, a difference of 1.9%), Navajo (6.9%, a difference of 8.2%), Alaska Native (6.8%, a difference of 9.8%), Immigrants from Yemen (8.3%, a difference of 10.2%), and Pima (6.6%, a difference of 13.3%).
| Demographics | Rating | Rank | Unemployment Among Ages 65 to 74 years |
| Paiute | 0.0 /100 | #333 | Tragic 6.3% |
| Taiwanese | 0.0 /100 | #334 | Tragic 6.3% |
| Puerto Ricans | 0.0 /100 | #335 | Tragic 6.4% |
| Immigrants | Armenia | 0.0 /100 | #336 | Tragic 6.5% |
| Ute | 0.0 /100 | #337 | Tragic 6.5% |
| Tlingit-Haida | 0.0 /100 | #338 | Tragic 6.5% |
| Yakama | 0.0 /100 | #339 | Tragic 6.6% |
| Pima | 0.0 /100 | #340 | Tragic 6.6% |
| Alaska Natives | 0.0 /100 | #341 | Tragic 6.8% |
| Navajo | 0.0 /100 | #342 | Tragic 6.9% |
| Alaskan Athabascans | 0.0 /100 | #343 | Tragic 7.4% |
| Inupiat | 0.0 /100 | #344 | Tragic 7.5% |
| Immigrants | Yemen | 0.0 /100 | #345 | Tragic 8.3% |
| Yup'ik | 0.0 /100 | #346 | Tragic 9.5% |
| Crow | 0.0 /100 | #347 | Tragic 17.4% |
Demographics Similar to Marshallese by Unemployment Among Ages 65 to 74 years
In terms of unemployment among ages 65 to 74 years, the demographic groups most similar to Marshallese are Immigrants from Sierra Leone (5.7%, a difference of 0.030%), Chippewa (5.7%, a difference of 0.080%), Central American Indian (5.7%, a difference of 0.080%), Cypriot (5.7%, a difference of 0.090%), and Ottawa (5.7%, a difference of 0.12%).
| Demographics | Rating | Rank | Unemployment Among Ages 65 to 74 years |
| Immigrants | Norway | 0.1 /100 | #279 | Tragic 5.7% |
| Moroccans | 0.1 /100 | #280 | Tragic 5.7% |
| Immigrants | West Indies | 0.1 /100 | #281 | Tragic 5.7% |
| Ottawa | 0.1 /100 | #282 | Tragic 5.7% |
| Cypriots | 0.1 /100 | #283 | Tragic 5.7% |
| Chippewa | 0.1 /100 | #284 | Tragic 5.7% |
| Immigrants | Sierra Leone | 0.1 /100 | #285 | Tragic 5.7% |
| Marshallese | 0.1 /100 | #286 | Tragic 5.7% |
| Central American Indians | 0.0 /100 | #287 | Tragic 5.7% |
| Central Americans | 0.0 /100 | #288 | Tragic 5.7% |
| Immigrants | Somalia | 0.0 /100 | #289 | Tragic 5.7% |
| Spanish American Indians | 0.0 /100 | #290 | Tragic 5.7% |
| Portuguese | 0.0 /100 | #291 | Tragic 5.7% |
| U.S. Virgin Islanders | 0.0 /100 | #292 | Tragic 5.8% |
| Immigrants | Grenada | 0.0 /100 | #293 | Tragic 5.8% |