Immigrants from Venezuela vs Marshallese Unemployment Among Ages 65 to 74 years
COMPARE
Immigrants from Venezuela
Marshallese
Unemployment Among Ages 65 to 74 years
Unemployment Among Ages 65 to 74 years Comparison
Immigrants from Venezuela
Marshallese
5.9%
UNEMPLOYMENT AMONG AGES 65 TO 74 YEARS
0.0/ 100
METRIC RATING
314th/ 347
METRIC RANK
5.7%
UNEMPLOYMENT AMONG AGES 65 TO 74 YEARS
0.1/ 100
METRIC RATING
286th/ 347
METRIC RANK
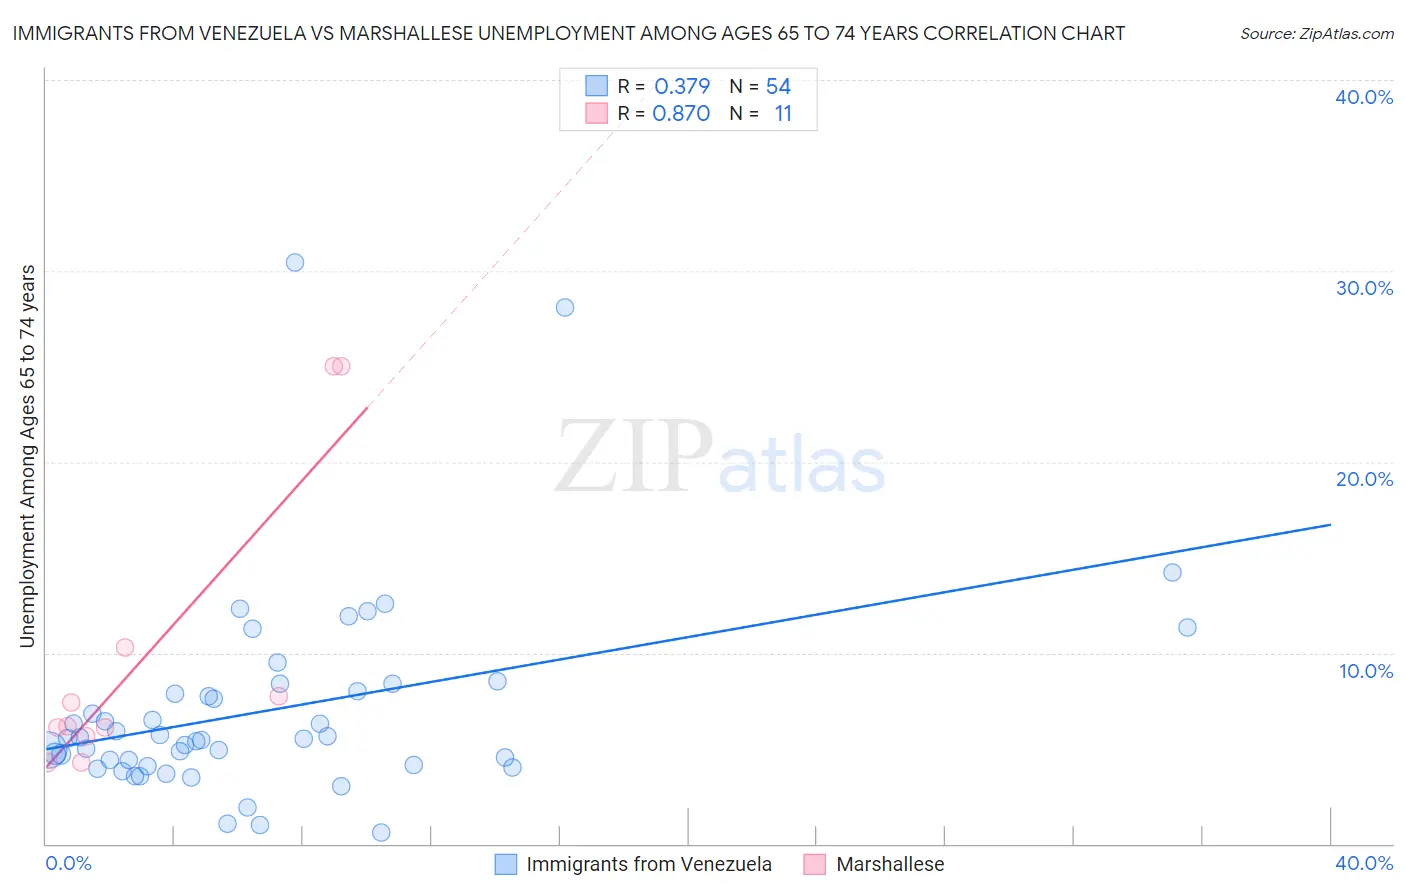
Immigrants from Venezuela vs Marshallese Unemployment Among Ages 65 to 74 years Correlation Chart
The statistical analysis conducted on geographies consisting of 263,535,725 people shows a mild positive correlation between the proportion of Immigrants from Venezuela and unemployment rate among population between the ages 65 and 74 in the United States with a correlation coefficient (R) of 0.379 and weighted average of 5.9%. Similarly, the statistical analysis conducted on geographies consisting of 14,110,955 people shows a very strong positive correlation between the proportion of Marshallese and unemployment rate among population between the ages 65 and 74 in the United States with a correlation coefficient (R) of 0.870 and weighted average of 5.7%, a difference of 3.0%.
Unemployment Among Ages 65 to 74 years Correlation Summary
| Measurement | Immigrants from Venezuela | Marshallese |
| Minimum | 0.60% | 4.2% |
| Maximum | 30.4% | 25.0% |
| Range | 29.8% | 20.8% |
| Mean | 7.0% | 9.8% |
| Median | 5.5% | 6.2% |
| Interquartile 25% (IQ1) | 4.1% | 5.6% |
| Interquartile 75% (IQ3) | 8.0% | 10.3% |
| Interquartile Range (IQR) | 3.9% | 4.7% |
| Standard Deviation (Sample) | 5.4% | 7.7% |
| Standard Deviation (Population) | 5.3% | 7.3% |
Similar Demographics by Unemployment Among Ages 65 to 74 years
Demographics Similar to Immigrants from Venezuela by Unemployment Among Ages 65 to 74 years
In terms of unemployment among ages 65 to 74 years, the demographic groups most similar to Immigrants from Venezuela are Immigrants from Guatemala (5.9%, a difference of 0.010%), Vietnamese (5.9%, a difference of 0.17%), Immigrants from El Salvador (5.9%, a difference of 0.33%), Hispanic or Latino (5.9%, a difference of 0.37%), and Venezuelan (5.9%, a difference of 0.39%).
| Demographics | Rating | Rank | Unemployment Among Ages 65 to 74 years |
| British West Indians | 0.0 /100 | #307 | Tragic 5.8% |
| Guatemalans | 0.0 /100 | #308 | Tragic 5.8% |
| Immigrants | Ecuador | 0.0 /100 | #309 | Tragic 5.8% |
| Immigrants | Bangladesh | 0.0 /100 | #310 | Tragic 5.9% |
| Venezuelans | 0.0 /100 | #311 | Tragic 5.9% |
| Hispanics or Latinos | 0.0 /100 | #312 | Tragic 5.9% |
| Vietnamese | 0.0 /100 | #313 | Tragic 5.9% |
| Immigrants | Venezuela | 0.0 /100 | #314 | Tragic 5.9% |
| Immigrants | Guatemala | 0.0 /100 | #315 | Tragic 5.9% |
| Immigrants | El Salvador | 0.0 /100 | #316 | Tragic 5.9% |
| Immigrants | Central America | 0.0 /100 | #317 | Tragic 5.9% |
| Zimbabweans | 0.0 /100 | #318 | Tragic 5.9% |
| Aleuts | 0.0 /100 | #319 | Tragic 5.9% |
| Immigrants | Bahamas | 0.0 /100 | #320 | Tragic 5.9% |
| Immigrants | Dominica | 0.0 /100 | #321 | Tragic 6.0% |
Demographics Similar to Marshallese by Unemployment Among Ages 65 to 74 years
In terms of unemployment among ages 65 to 74 years, the demographic groups most similar to Marshallese are Immigrants from Sierra Leone (5.7%, a difference of 0.030%), Chippewa (5.7%, a difference of 0.080%), Central American Indian (5.7%, a difference of 0.080%), Cypriot (5.7%, a difference of 0.090%), and Ottawa (5.7%, a difference of 0.12%).
| Demographics | Rating | Rank | Unemployment Among Ages 65 to 74 years |
| Immigrants | Norway | 0.1 /100 | #279 | Tragic 5.7% |
| Moroccans | 0.1 /100 | #280 | Tragic 5.7% |
| Immigrants | West Indies | 0.1 /100 | #281 | Tragic 5.7% |
| Ottawa | 0.1 /100 | #282 | Tragic 5.7% |
| Cypriots | 0.1 /100 | #283 | Tragic 5.7% |
| Chippewa | 0.1 /100 | #284 | Tragic 5.7% |
| Immigrants | Sierra Leone | 0.1 /100 | #285 | Tragic 5.7% |
| Marshallese | 0.1 /100 | #286 | Tragic 5.7% |
| Central American Indians | 0.0 /100 | #287 | Tragic 5.7% |
| Central Americans | 0.0 /100 | #288 | Tragic 5.7% |
| Immigrants | Somalia | 0.0 /100 | #289 | Tragic 5.7% |
| Spanish American Indians | 0.0 /100 | #290 | Tragic 5.7% |
| Portuguese | 0.0 /100 | #291 | Tragic 5.7% |
| U.S. Virgin Islanders | 0.0 /100 | #292 | Tragic 5.8% |
| Immigrants | Grenada | 0.0 /100 | #293 | Tragic 5.8% |