Indonesian vs Immigrants from Bosnia and Herzegovina Unemployment Among Ages 30 to 34 years
COMPARE
Indonesian
Immigrants from Bosnia and Herzegovina
Unemployment Among Ages 30 to 34 years
Unemployment Among Ages 30 to 34 years Comparison
Indonesians
Immigrants from Bosnia and Herzegovina
5.2%
UNEMPLOYMENT AMONG AGES 30 TO 34 YEARS
95.1/ 100
METRIC RATING
78th/ 347
METRIC RANK
4.7%
UNEMPLOYMENT AMONG AGES 30 TO 34 YEARS
100.0/ 100
METRIC RATING
6th/ 347
METRIC RANK
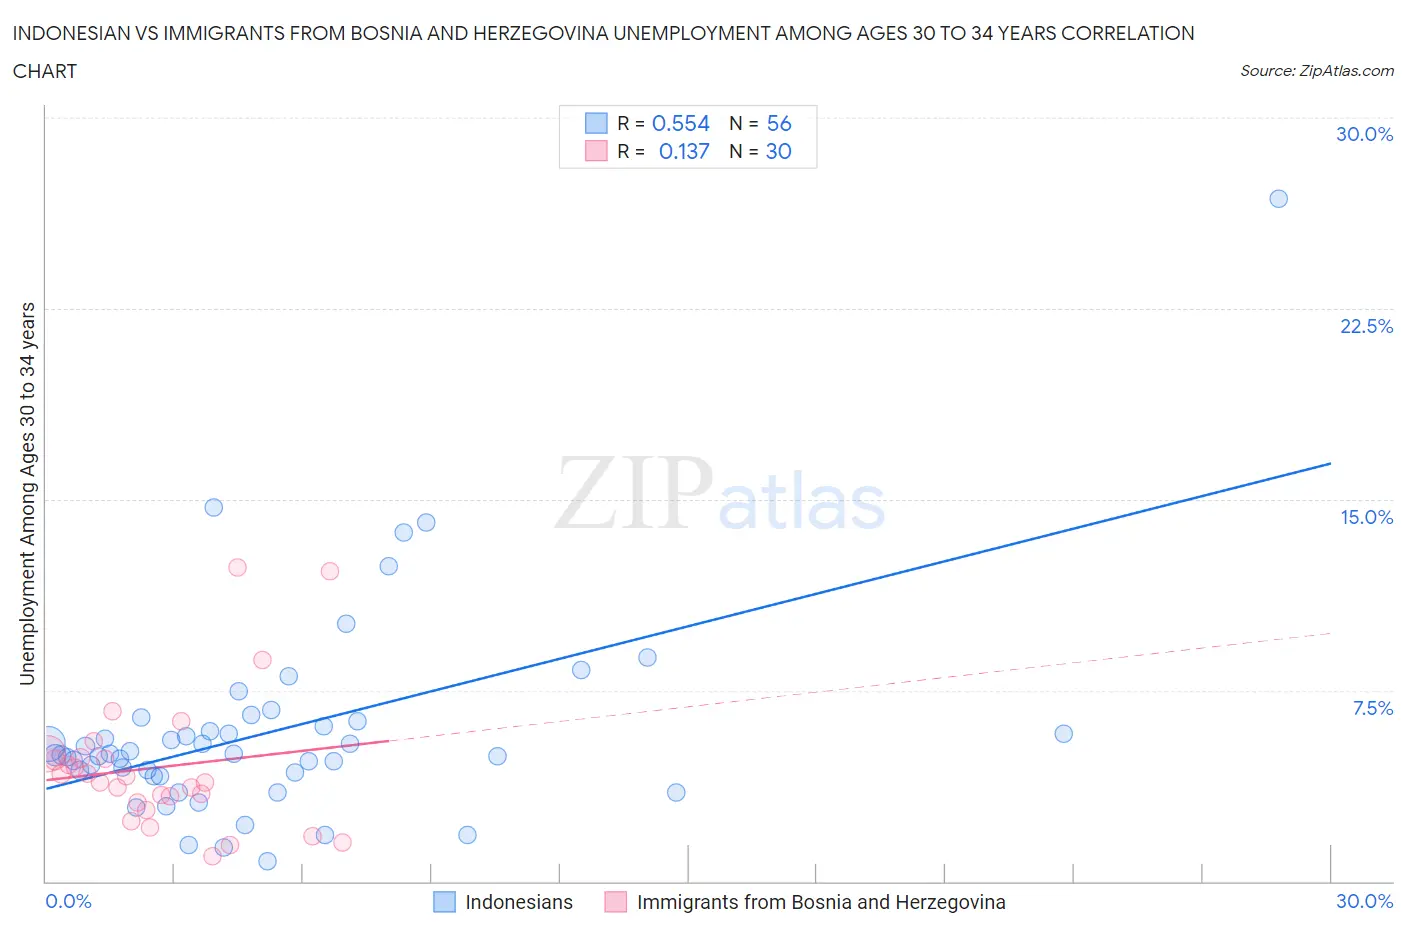
Indonesian vs Immigrants from Bosnia and Herzegovina Unemployment Among Ages 30 to 34 years Correlation Chart
The statistical analysis conducted on geographies consisting of 159,189,213 people shows a substantial positive correlation between the proportion of Indonesians and unemployment rate among population between the ages 30 and 34 in the United States with a correlation coefficient (R) of 0.554 and weighted average of 5.2%. Similarly, the statistical analysis conducted on geographies consisting of 152,450,998 people shows a poor positive correlation between the proportion of Immigrants from Bosnia and Herzegovina and unemployment rate among population between the ages 30 and 34 in the United States with a correlation coefficient (R) of 0.137 and weighted average of 4.7%, a difference of 10.0%.
Unemployment Among Ages 30 to 34 years Correlation Summary
| Measurement | Indonesian | Immigrants from Bosnia and Herzegovina |
| Minimum | 0.80% | 1.0% |
| Maximum | 26.8% | 12.3% |
| Range | 26.0% | 11.3% |
| Mean | 5.9% | 4.5% |
| Median | 5.0% | 4.0% |
| Interquartile 25% (IQ1) | 4.2% | 3.1% |
| Interquartile 75% (IQ3) | 6.2% | 4.8% |
| Interquartile Range (IQR) | 2.0% | 1.7% |
| Standard Deviation (Sample) | 4.1% | 2.7% |
| Standard Deviation (Population) | 4.0% | 2.6% |
Similar Demographics by Unemployment Among Ages 30 to 34 years
Demographics Similar to Indonesians by Unemployment Among Ages 30 to 34 years
In terms of unemployment among ages 30 to 34 years, the demographic groups most similar to Indonesians are Immigrants from Lithuania (5.2%, a difference of 0.050%), Uruguayan (5.2%, a difference of 0.13%), Immigrants from Indonesia (5.2%, a difference of 0.15%), Scandinavian (5.2%, a difference of 0.20%), and Chilean (5.2%, a difference of 0.25%).
| Demographics | Rating | Rank | Unemployment Among Ages 30 to 34 years |
| Paraguayans | 96.4 /100 | #71 | Exceptional 5.1% |
| Immigrants | Moldova | 96.4 /100 | #72 | Exceptional 5.1% |
| Slovenes | 96.2 /100 | #73 | Exceptional 5.2% |
| Immigrants | Asia | 96.2 /100 | #74 | Exceptional 5.2% |
| Iranians | 96.0 /100 | #75 | Exceptional 5.2% |
| Scandinavians | 95.6 /100 | #76 | Exceptional 5.2% |
| Uruguayans | 95.4 /100 | #77 | Exceptional 5.2% |
| Indonesians | 95.1 /100 | #78 | Exceptional 5.2% |
| Immigrants | Lithuania | 95.0 /100 | #79 | Exceptional 5.2% |
| Immigrants | Indonesia | 94.7 /100 | #80 | Exceptional 5.2% |
| Chileans | 94.4 /100 | #81 | Exceptional 5.2% |
| Immigrants | Latvia | 94.2 /100 | #82 | Exceptional 5.2% |
| Immigrants | Korea | 94.1 /100 | #83 | Exceptional 5.2% |
| Immigrants | Uganda | 94.0 /100 | #84 | Exceptional 5.2% |
| Immigrants | Egypt | 93.9 /100 | #85 | Exceptional 5.2% |
Demographics Similar to Immigrants from Bosnia and Herzegovina by Unemployment Among Ages 30 to 34 years
In terms of unemployment among ages 30 to 34 years, the demographic groups most similar to Immigrants from Bosnia and Herzegovina are Thai (4.7%, a difference of 0.20%), Venezuelan (4.7%, a difference of 0.23%), Immigrants from Eritrea (4.7%, a difference of 0.38%), Bulgarian (4.7%, a difference of 0.69%), and Immigrants from Nepal (4.7%, a difference of 0.87%).
| Demographics | Rating | Rank | Unemployment Among Ages 30 to 34 years |
| Immigrants | India | 100.0 /100 | #1 | Exceptional 4.5% |
| Sudanese | 100.0 /100 | #2 | Exceptional 4.6% |
| Immigrants | Venezuela | 100.0 /100 | #3 | Exceptional 4.6% |
| Immigrants | Nepal | 100.0 /100 | #4 | Exceptional 4.7% |
| Venezuelans | 100.0 /100 | #5 | Exceptional 4.7% |
| Immigrants | Bosnia and Herzegovina | 100.0 /100 | #6 | Exceptional 4.7% |
| Thais | 100.0 /100 | #7 | Exceptional 4.7% |
| Immigrants | Eritrea | 100.0 /100 | #8 | Exceptional 4.7% |
| Bulgarians | 99.9 /100 | #9 | Exceptional 4.7% |
| Tongans | 99.9 /100 | #10 | Exceptional 4.8% |
| Immigrants | Bolivia | 99.9 /100 | #11 | Exceptional 4.8% |
| Filipinos | 99.9 /100 | #12 | Exceptional 4.8% |
| Cambodians | 99.9 /100 | #13 | Exceptional 4.8% |
| Luxembourgers | 99.9 /100 | #14 | Exceptional 4.8% |
| Okinawans | 99.9 /100 | #15 | Exceptional 4.8% |