Polish vs Immigrants from Barbados Unemployment Among Ages 16 to 19 years
COMPARE
Polish
Immigrants from Barbados
Unemployment Among Ages 16 to 19 years
Unemployment Among Ages 16 to 19 years Comparison
Poles
Immigrants from Barbados
16.4%
UNEMPLOYMENT AMONG AGES 16 TO 19 YEARS
99.7/ 100
METRIC RATING
45th/ 347
METRIC RANK
24.0%
UNEMPLOYMENT AMONG AGES 16 TO 19 YEARS
0.0/ 100
METRIC RATING
332nd/ 347
METRIC RANK
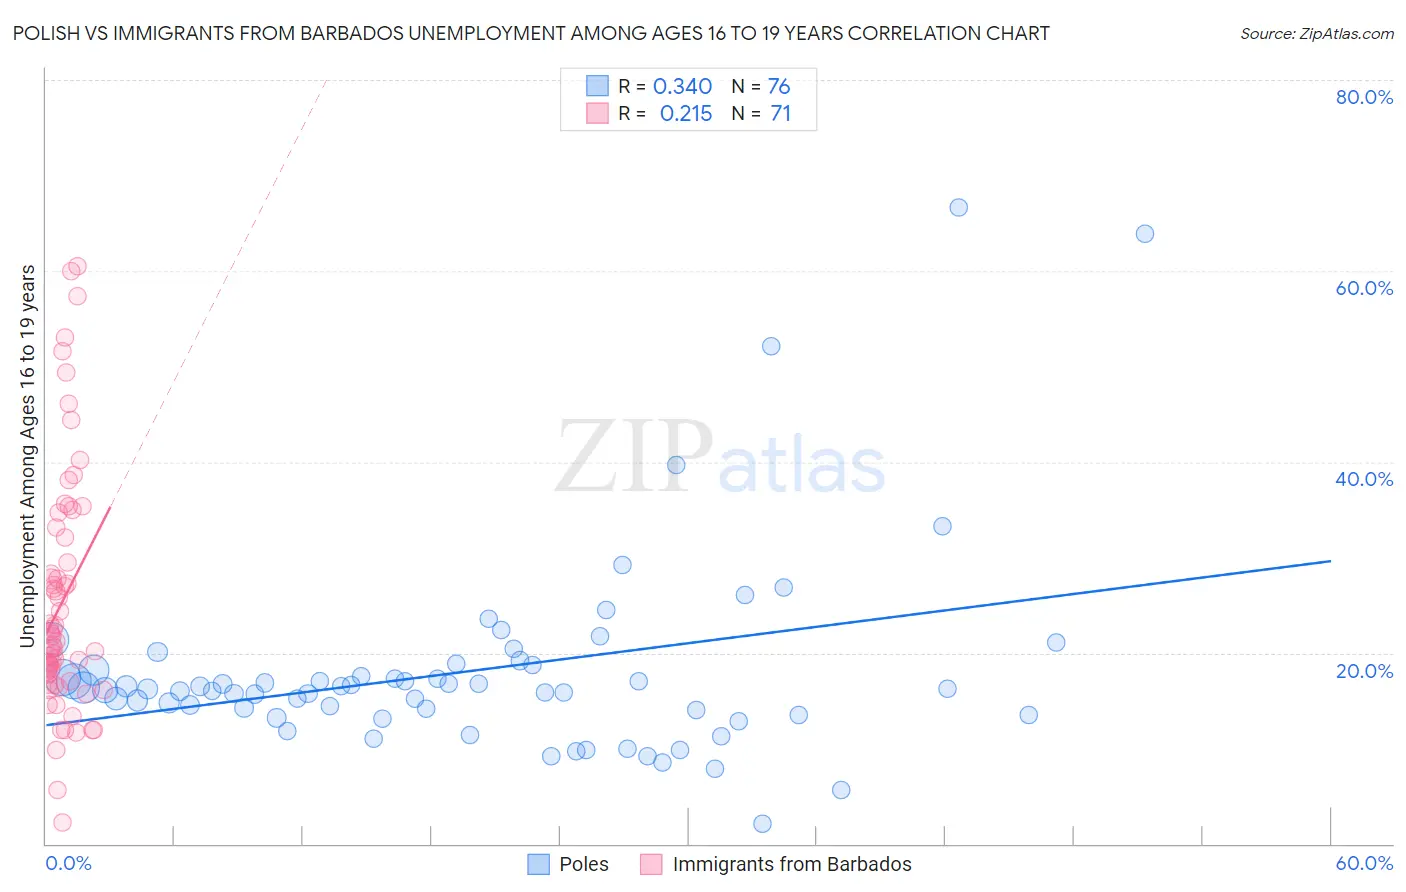
Polish vs Immigrants from Barbados Unemployment Among Ages 16 to 19 years Correlation Chart
The statistical analysis conducted on geographies consisting of 501,289,660 people shows a mild positive correlation between the proportion of Poles and unemployment rate among population between the ages 16 and 19 in the United States with a correlation coefficient (R) of 0.340 and weighted average of 16.4%. Similarly, the statistical analysis conducted on geographies consisting of 110,917,290 people shows a weak positive correlation between the proportion of Immigrants from Barbados and unemployment rate among population between the ages 16 and 19 in the United States with a correlation coefficient (R) of 0.215 and weighted average of 24.0%, a difference of 46.9%.
Unemployment Among Ages 16 to 19 years Correlation Summary
| Measurement | Polish | Immigrants from Barbados |
| Minimum | 2.1% | 2.2% |
| Maximum | 66.7% | 60.5% |
| Range | 64.6% | 58.3% |
| Mean | 18.1% | 25.3% |
| Median | 16.3% | 21.2% |
| Interquartile 25% (IQ1) | 13.8% | 17.0% |
| Interquartile 75% (IQ3) | 18.5% | 32.1% |
| Interquartile Range (IQR) | 4.7% | 15.1% |
| Standard Deviation (Sample) | 10.5% | 12.7% |
| Standard Deviation (Population) | 10.4% | 12.6% |
Similar Demographics by Unemployment Among Ages 16 to 19 years
Demographics Similar to Poles by Unemployment Among Ages 16 to 19 years
In terms of unemployment among ages 16 to 19 years, the demographic groups most similar to Poles are Immigrants from Zimbabwe (16.3%, a difference of 0.020%), Immigrants from North Macedonia (16.4%, a difference of 0.020%), Immigrants from Vietnam (16.4%, a difference of 0.090%), Immigrants from Lebanon (16.3%, a difference of 0.14%), and Maltese (16.4%, a difference of 0.14%).
| Demographics | Rating | Rank | Unemployment Among Ages 16 to 19 years |
| Bulgarians | 99.8 /100 | #38 | Exceptional 16.3% |
| Croatians | 99.8 /100 | #39 | Exceptional 16.3% |
| Hmong | 99.8 /100 | #40 | Exceptional 16.3% |
| Immigrants | Nepal | 99.8 /100 | #41 | Exceptional 16.3% |
| Fijians | 99.8 /100 | #42 | Exceptional 16.3% |
| Immigrants | Lebanon | 99.8 /100 | #43 | Exceptional 16.3% |
| Immigrants | Zimbabwe | 99.7 /100 | #44 | Exceptional 16.3% |
| Poles | 99.7 /100 | #45 | Exceptional 16.4% |
| Immigrants | North Macedonia | 99.7 /100 | #46 | Exceptional 16.4% |
| Immigrants | Vietnam | 99.7 /100 | #47 | Exceptional 16.4% |
| Maltese | 99.7 /100 | #48 | Exceptional 16.4% |
| Iraqis | 99.7 /100 | #49 | Exceptional 16.4% |
| Bhutanese | 99.6 /100 | #50 | Exceptional 16.4% |
| Lebanese | 99.6 /100 | #51 | Exceptional 16.4% |
| Welsh | 99.6 /100 | #52 | Exceptional 16.4% |
Demographics Similar to Immigrants from Barbados by Unemployment Among Ages 16 to 19 years
In terms of unemployment among ages 16 to 19 years, the demographic groups most similar to Immigrants from Barbados are British West Indian (24.0%, a difference of 0.17%), Paiute (24.4%, a difference of 1.4%), Dominican (23.6%, a difference of 1.6%), Tlingit-Haida (23.5%, a difference of 2.0%), and Immigrants from Dominican Republic (23.3%, a difference of 3.1%).
| Demographics | Rating | Rank | Unemployment Among Ages 16 to 19 years |
| Trinidadians and Tobagonians | 0.0 /100 | #325 | Tragic 22.6% |
| Immigrants | Trinidad and Tobago | 0.0 /100 | #326 | Tragic 23.1% |
| Pima | 0.0 /100 | #327 | Tragic 23.1% |
| Immigrants | Dominican Republic | 0.0 /100 | #328 | Tragic 23.3% |
| Tlingit-Haida | 0.0 /100 | #329 | Tragic 23.5% |
| Dominicans | 0.0 /100 | #330 | Tragic 23.6% |
| British West Indians | 0.0 /100 | #331 | Tragic 24.0% |
| Immigrants | Barbados | 0.0 /100 | #332 | Tragic 24.0% |
| Paiute | 0.0 /100 | #333 | Tragic 24.4% |
| Guyanese | 0.0 /100 | #334 | Tragic 24.8% |
| Arapaho | 0.0 /100 | #335 | Tragic 25.2% |
| Kiowa | 0.0 /100 | #336 | Tragic 25.2% |
| Immigrants | Guyana | 0.0 /100 | #337 | Tragic 25.5% |
| Immigrants | St. Vincent and the Grenadines | 0.0 /100 | #338 | Tragic 25.7% |
| Immigrants | Grenada | 0.0 /100 | #339 | Tragic 25.7% |