Immigrants vs Immigrants from Panama Unemployment Among Ages 45 to 54 years
COMPARE
Immigrants
Immigrants from Panama
Unemployment Among Ages 45 to 54 years
Unemployment Among Ages 45 to 54 years Comparison
Immigrants
Immigrants from Panama
4.7%
UNEMPLOYMENT AMONG AGES 45 TO 54 YEARS
2.6/ 100
METRIC RATING
233rd/ 347
METRIC RANK
4.6%
UNEMPLOYMENT AMONG AGES 45 TO 54 YEARS
10.4/ 100
METRIC RATING
215th/ 347
METRIC RANK
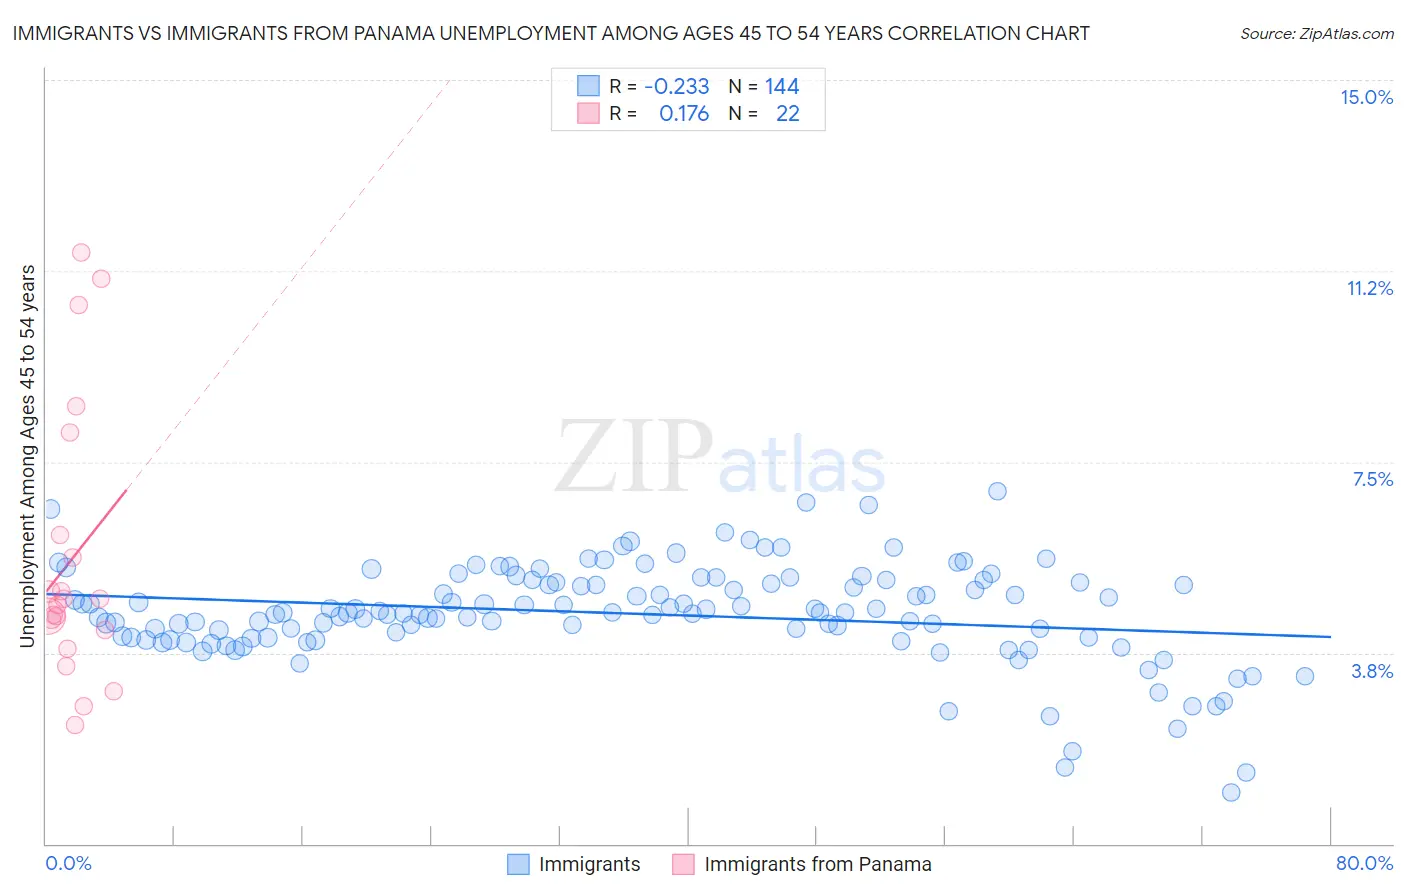
Immigrants vs Immigrants from Panama Unemployment Among Ages 45 to 54 years Correlation Chart
The statistical analysis conducted on geographies consisting of 533,580,848 people shows a weak negative correlation between the proportion of Immigrants and unemployment rate among population between the ages 45 and 54 in the United States with a correlation coefficient (R) of -0.233 and weighted average of 4.7%. Similarly, the statistical analysis conducted on geographies consisting of 218,746,510 people shows a poor positive correlation between the proportion of Immigrants from Panama and unemployment rate among population between the ages 45 and 54 in the United States with a correlation coefficient (R) of 0.176 and weighted average of 4.6%, a difference of 1.7%.
Unemployment Among Ages 45 to 54 years Correlation Summary
| Measurement | Immigrants | Immigrants from Panama |
| Minimum | 1.0% | 2.3% |
| Maximum | 6.9% | 11.6% |
| Range | 5.9% | 9.3% |
| Mean | 4.5% | 5.6% |
| Median | 4.5% | 4.7% |
| Interquartile 25% (IQ1) | 4.0% | 4.2% |
| Interquartile 75% (IQ3) | 5.1% | 6.1% |
| Interquartile Range (IQR) | 1.1% | 1.9% |
| Standard Deviation (Sample) | 0.98% | 2.7% |
| Standard Deviation (Population) | 0.97% | 2.6% |
Demographics Similar to Immigrants and Immigrants from Panama by Unemployment Among Ages 45 to 54 years
In terms of unemployment among ages 45 to 54 years, the demographic groups most similar to Immigrants are Soviet Union (4.7%, a difference of 0.020%), Immigrants from Ireland (4.7%, a difference of 0.040%), Ottawa (4.7%, a difference of 0.040%), Japanese (4.7%, a difference of 0.080%), and Immigrants from Israel (4.7%, a difference of 0.16%). Similarly, the demographic groups most similar to Immigrants from Panama are Cherokee (4.6%, a difference of 0.020%), Lumbee (4.6%, a difference of 0.15%), Immigrants from Cambodia (4.7%, a difference of 0.42%), Immigrants from Uganda (4.7%, a difference of 0.47%), and Nigerian (4.7%, a difference of 0.50%).
| Demographics | Rating | Rank | Unemployment Among Ages 45 to 54 years |
| Cherokee | 10.6 /100 | #214 | Poor 4.6% |
| Immigrants | Panama | 10.4 /100 | #215 | Poor 4.6% |
| Lumbee | 9.2 /100 | #216 | Tragic 4.6% |
| Immigrants | Cambodia | 7.4 /100 | #217 | Tragic 4.7% |
| Immigrants | Uganda | 7.1 /100 | #218 | Tragic 4.7% |
| Nigerians | 7.0 /100 | #219 | Tragic 4.7% |
| Guamanians/Chamorros | 6.8 /100 | #220 | Tragic 4.7% |
| Choctaw | 6.1 /100 | #221 | Tragic 4.7% |
| Immigrants | Southern Europe | 6.0 /100 | #222 | Tragic 4.7% |
| Potawatomi | 5.7 /100 | #223 | Tragic 4.7% |
| Comanche | 4.8 /100 | #224 | Tragic 4.7% |
| Immigrants | Norway | 4.8 /100 | #225 | Tragic 4.7% |
| Assyrians/Chaldeans/Syriacs | 3.5 /100 | #226 | Tragic 4.7% |
| Iraqis | 3.2 /100 | #227 | Tragic 4.7% |
| South American Indians | 3.1 /100 | #228 | Tragic 4.7% |
| Immigrants | Israel | 3.0 /100 | #229 | Tragic 4.7% |
| Japanese | 2.8 /100 | #230 | Tragic 4.7% |
| Immigrants | Ireland | 2.7 /100 | #231 | Tragic 4.7% |
| Ottawa | 2.7 /100 | #232 | Tragic 4.7% |
| Immigrants | Immigrants | 2.6 /100 | #233 | Tragic 4.7% |
| Soviet Union | 2.6 /100 | #234 | Tragic 4.7% |