Immigrants from Ukraine vs Immigrants from Portugal Unemployment
COMPARE
Immigrants from Ukraine
Immigrants from Portugal
Unemployment
Unemployment Comparison
Immigrants from Ukraine
Immigrants from Portugal
5.3%
UNEMPLOYMENT
24.9/ 100
METRIC RATING
204th/ 347
METRIC RANK
5.7%
UNEMPLOYMENT
0.2/ 100
METRIC RATING
255th/ 347
METRIC RANK
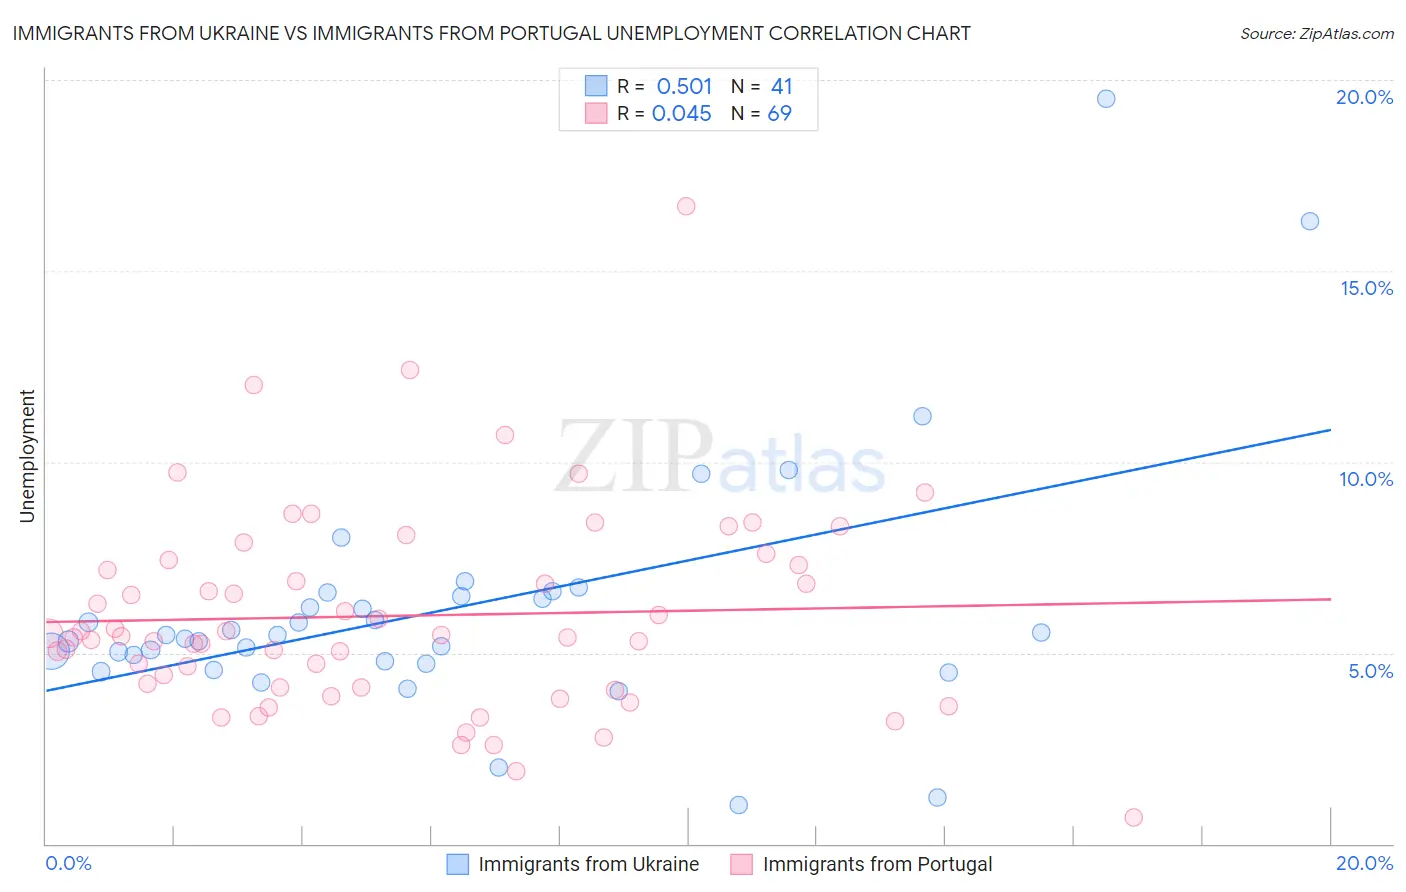
Immigrants from Ukraine vs Immigrants from Portugal Unemployment Correlation Chart
The statistical analysis conducted on geographies consisting of 289,507,163 people shows a substantial positive correlation between the proportion of Immigrants from Ukraine and unemployment in the United States with a correlation coefficient (R) of 0.501 and weighted average of 5.3%. Similarly, the statistical analysis conducted on geographies consisting of 174,742,748 people shows no correlation between the proportion of Immigrants from Portugal and unemployment in the United States with a correlation coefficient (R) of 0.045 and weighted average of 5.7%, a difference of 7.5%.
Unemployment Correlation Summary
| Measurement | Immigrants from Ukraine | Immigrants from Portugal |
| Minimum | 1.0% | 0.70% |
| Maximum | 19.5% | 16.7% |
| Range | 18.5% | 16.0% |
| Mean | 6.1% | 6.0% |
| Median | 5.5% | 5.4% |
| Interquartile 25% (IQ1) | 4.7% | 4.1% |
| Interquartile 75% (IQ3) | 6.5% | 7.4% |
| Interquartile Range (IQR) | 1.8% | 3.3% |
| Standard Deviation (Sample) | 3.3% | 2.7% |
| Standard Deviation (Population) | 3.3% | 2.6% |
Similar Demographics by Unemployment
Demographics Similar to Immigrants from Ukraine by Unemployment
In terms of unemployment, the demographic groups most similar to Immigrants from Ukraine are Immigrants from Micronesia (5.3%, a difference of 0.030%), Cherokee (5.3%, a difference of 0.050%), Native Hawaiian (5.3%, a difference of 0.060%), Immigrants from South Eastern Asia (5.3%, a difference of 0.17%), and Immigrants from Peru (5.4%, a difference of 0.18%).
| Demographics | Rating | Rank | Unemployment |
| Immigrants | Uruguay | 29.8 /100 | #197 | Fair 5.3% |
| Immigrants | Israel | 28.6 /100 | #198 | Fair 5.3% |
| Immigrants | Afghanistan | 28.6 /100 | #199 | Fair 5.3% |
| Koreans | 27.4 /100 | #200 | Fair 5.3% |
| Immigrants | South Eastern Asia | 27.0 /100 | #201 | Fair 5.3% |
| Cherokee | 25.5 /100 | #202 | Fair 5.3% |
| Immigrants | Micronesia | 25.2 /100 | #203 | Fair 5.3% |
| Immigrants | Ukraine | 24.9 /100 | #204 | Fair 5.3% |
| Native Hawaiians | 24.1 /100 | #205 | Fair 5.3% |
| Immigrants | Peru | 22.7 /100 | #206 | Fair 5.4% |
| Creek | 19.4 /100 | #207 | Poor 5.4% |
| Portuguese | 19.0 /100 | #208 | Poor 5.4% |
| Immigrants | Iran | 18.8 /100 | #209 | Poor 5.4% |
| Immigrants | Iraq | 18.6 /100 | #210 | Poor 5.4% |
| Iraqis | 18.1 /100 | #211 | Poor 5.4% |
Demographics Similar to Immigrants from Portugal by Unemployment
In terms of unemployment, the demographic groups most similar to Immigrants from Portugal are Guatemalan (5.8%, a difference of 0.21%), Immigrants from Honduras (5.7%, a difference of 0.44%), Yaqui (5.8%, a difference of 0.51%), Central American (5.7%, a difference of 0.52%), and Honduran (5.7%, a difference of 0.53%).
| Demographics | Rating | Rank | Unemployment |
| Liberians | 0.9 /100 | #248 | Tragic 5.6% |
| Cajuns | 0.8 /100 | #249 | Tragic 5.6% |
| Japanese | 0.8 /100 | #250 | Tragic 5.6% |
| Kiowa | 0.6 /100 | #251 | Tragic 5.7% |
| Hondurans | 0.3 /100 | #252 | Tragic 5.7% |
| Central Americans | 0.3 /100 | #253 | Tragic 5.7% |
| Immigrants | Honduras | 0.3 /100 | #254 | Tragic 5.7% |
| Immigrants | Portugal | 0.2 /100 | #255 | Tragic 5.7% |
| Guatemalans | 0.2 /100 | #256 | Tragic 5.8% |
| Yaqui | 0.2 /100 | #257 | Tragic 5.8% |
| Immigrants | Bahamas | 0.1 /100 | #258 | Tragic 5.8% |
| Sub-Saharan Africans | 0.1 /100 | #259 | Tragic 5.8% |
| Immigrants | Uzbekistan | 0.1 /100 | #260 | Tragic 5.8% |
| Immigrants | Guatemala | 0.1 /100 | #261 | Tragic 5.8% |
| Sierra Leoneans | 0.1 /100 | #262 | Tragic 5.8% |