Bangladeshi vs South African Unemployment Among Ages 65 to 74 years
COMPARE
Bangladeshi
South African
Unemployment Among Ages 65 to 74 years
Unemployment Among Ages 65 to 74 years Comparison
Bangladeshis
South Africans
5.3%
UNEMPLOYMENT AMONG AGES 65 TO 74 YEARS
65.8/ 100
METRIC RATING
160th/ 347
METRIC RANK
5.2%
UNEMPLOYMENT AMONG AGES 65 TO 74 YEARS
97.1/ 100
METRIC RATING
94th/ 347
METRIC RANK
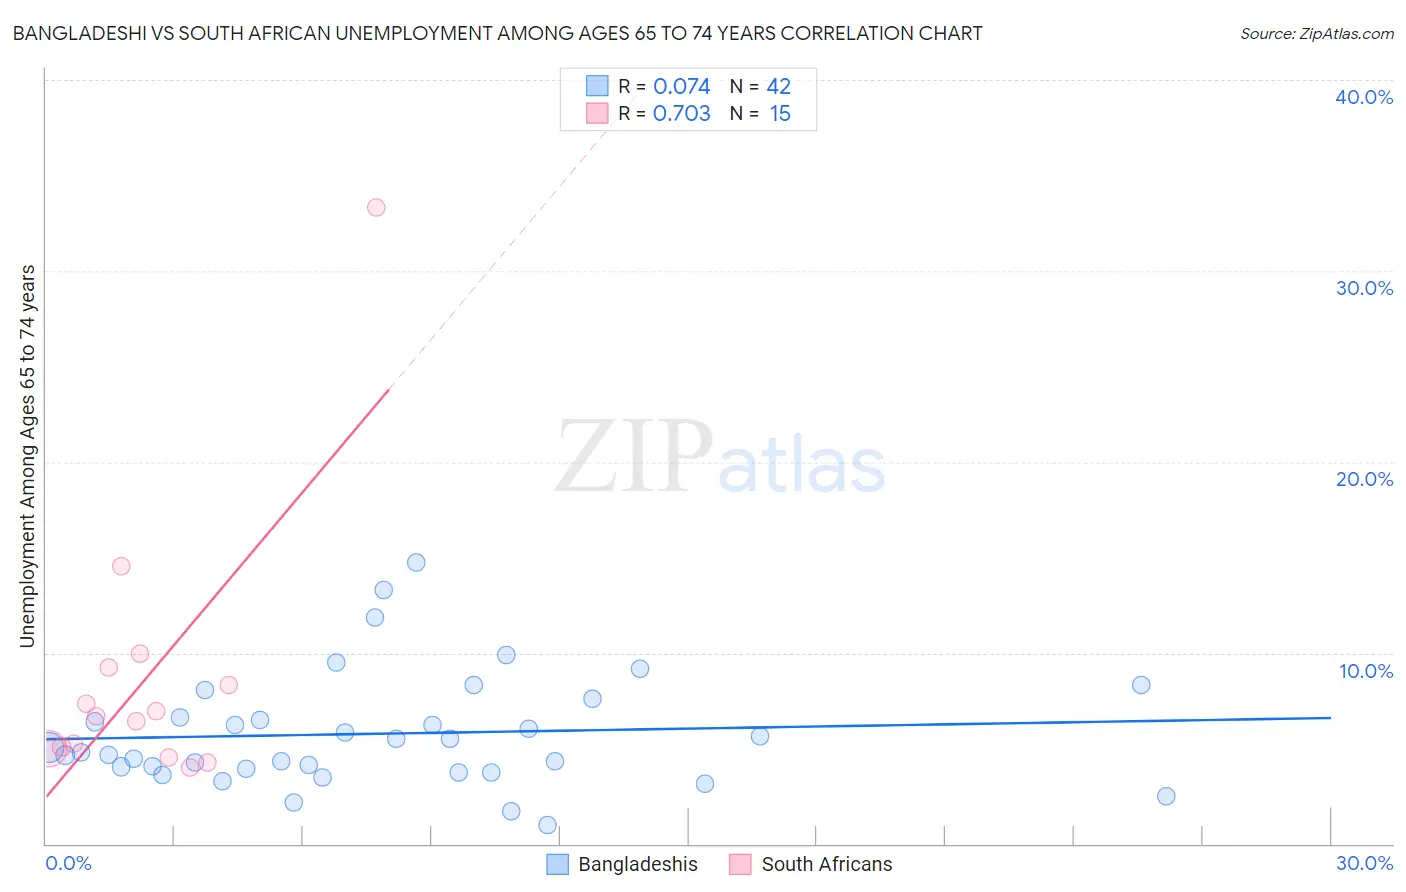
Bangladeshi vs South African Unemployment Among Ages 65 to 74 years Correlation Chart
The statistical analysis conducted on geographies consisting of 130,927,495 people shows a slight positive correlation between the proportion of Bangladeshis and unemployment rate among population between the ages 65 and 74 in the United States with a correlation coefficient (R) of 0.074 and weighted average of 5.3%. Similarly, the statistical analysis conducted on geographies consisting of 170,569,944 people shows a strong positive correlation between the proportion of South Africans and unemployment rate among population between the ages 65 and 74 in the United States with a correlation coefficient (R) of 0.703 and weighted average of 5.2%, a difference of 2.4%.
Unemployment Among Ages 65 to 74 years Correlation Summary
| Measurement | Bangladeshi | South African |
| Minimum | 1.0% | 4.0% |
| Maximum | 14.7% | 33.3% |
| Range | 13.7% | 29.3% |
| Mean | 5.8% | 8.7% |
| Median | 4.9% | 6.7% |
| Interquartile 25% (IQ1) | 3.9% | 5.0% |
| Interquartile 75% (IQ3) | 6.6% | 9.2% |
| Interquartile Range (IQR) | 2.7% | 4.2% |
| Standard Deviation (Sample) | 3.0% | 7.3% |
| Standard Deviation (Population) | 2.9% | 7.1% |
Similar Demographics by Unemployment Among Ages 65 to 74 years
Demographics Similar to Bangladeshis by Unemployment Among Ages 65 to 74 years
In terms of unemployment among ages 65 to 74 years, the demographic groups most similar to Bangladeshis are Immigrants from Czechoslovakia (5.3%, a difference of 0.020%), Immigrants from Italy (5.3%, a difference of 0.070%), Immigrants from Eastern Asia (5.3%, a difference of 0.12%), Mongolian (5.3%, a difference of 0.13%), and Immigrants from Philippines (5.3%, a difference of 0.17%).
| Demographics | Rating | Rank | Unemployment Among Ages 65 to 74 years |
| Immigrants | Cabo Verde | 72.5 /100 | #153 | Good 5.3% |
| Poles | 72.4 /100 | #154 | Good 5.3% |
| Immigrants | Cameroon | 72.1 /100 | #155 | Good 5.3% |
| Dutch | 72.0 /100 | #156 | Good 5.3% |
| Immigrants | Eastern Europe | 71.5 /100 | #157 | Good 5.3% |
| Immigrants | France | 71.0 /100 | #158 | Good 5.3% |
| Immigrants | Czechoslovakia | 66.3 /100 | #159 | Good 5.3% |
| Bangladeshis | 65.8 /100 | #160 | Good 5.3% |
| Immigrants | Italy | 63.7 /100 | #161 | Good 5.3% |
| Immigrants | Eastern Asia | 62.5 /100 | #162 | Good 5.3% |
| Mongolians | 62.3 /100 | #163 | Good 5.3% |
| Immigrants | Philippines | 61.2 /100 | #164 | Good 5.3% |
| Immigrants | Bosnia and Herzegovina | 60.2 /100 | #165 | Good 5.3% |
| Slovaks | 60.0 /100 | #166 | Good 5.3% |
| Indians (Asian) | 59.9 /100 | #167 | Average 5.3% |
Demographics Similar to South Africans by Unemployment Among Ages 65 to 74 years
In terms of unemployment among ages 65 to 74 years, the demographic groups most similar to South Africans are Serbian (5.2%, a difference of 0.0%), Immigrants from Netherlands (5.2%, a difference of 0.020%), Immigrants from Thailand (5.2%, a difference of 0.030%), Puget Sound Salish (5.2%, a difference of 0.080%), and Romanian (5.2%, a difference of 0.10%).
| Demographics | Rating | Rank | Unemployment Among Ages 65 to 74 years |
| Scottish | 97.9 /100 | #87 | Exceptional 5.2% |
| Immigrants | Saudi Arabia | 97.9 /100 | #88 | Exceptional 5.2% |
| English | 97.8 /100 | #89 | Exceptional 5.2% |
| Luxembourgers | 97.6 /100 | #90 | Exceptional 5.2% |
| Romanians | 97.4 /100 | #91 | Exceptional 5.2% |
| Puget Sound Salish | 97.3 /100 | #92 | Exceptional 5.2% |
| Immigrants | Netherlands | 97.1 /100 | #93 | Exceptional 5.2% |
| South Africans | 97.1 /100 | #94 | Exceptional 5.2% |
| Serbians | 97.0 /100 | #95 | Exceptional 5.2% |
| Immigrants | Thailand | 97.0 /100 | #96 | Exceptional 5.2% |
| Senegalese | 96.5 /100 | #97 | Exceptional 5.2% |
| Welsh | 96.5 /100 | #98 | Exceptional 5.2% |
| Burmese | 96.4 /100 | #99 | Exceptional 5.2% |
| Japanese | 96.4 /100 | #100 | Exceptional 5.2% |
| Immigrants | Cambodia | 96.3 /100 | #101 | Exceptional 5.2% |