Immigrants from Netherlands vs Immigrants from Western Asia Unemployment Among Seniors over 75 years
COMPARE
Immigrants from Netherlands
Immigrants from Western Asia
Unemployment Among Seniors over 75 years
Unemployment Among Seniors over 75 years Comparison
Immigrants from Netherlands
Immigrants from Western Asia
8.1%
UNEMPLOYMENT AMONG SENIORS OVER 75 YEARS
99.5/ 100
METRIC RATING
93rd/ 347
METRIC RANK
9.0%
UNEMPLOYMENT AMONG SENIORS OVER 75 YEARS
12.5/ 100
METRIC RATING
215th/ 347
METRIC RANK
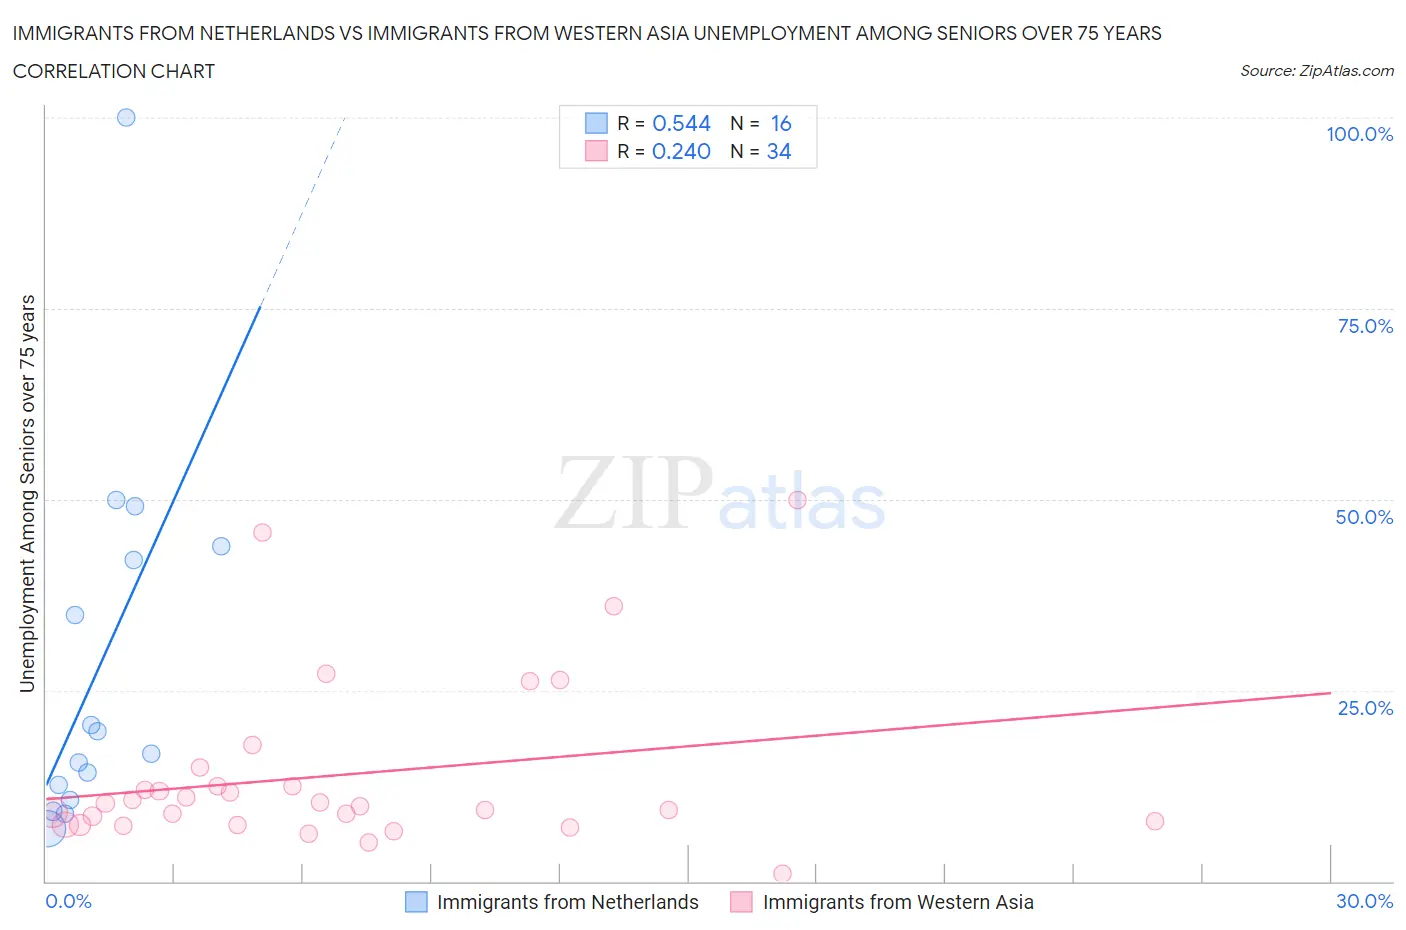
Immigrants from Netherlands vs Immigrants from Western Asia Unemployment Among Seniors over 75 years Correlation Chart
The statistical analysis conducted on geographies consisting of 147,093,510 people shows a substantial positive correlation between the proportion of Immigrants from Netherlands and unemployment rate among seniors over the age of 75 in the United States with a correlation coefficient (R) of 0.544 and weighted average of 8.1%. Similarly, the statistical analysis conducted on geographies consisting of 206,828,449 people shows a weak positive correlation between the proportion of Immigrants from Western Asia and unemployment rate among seniors over the age of 75 in the United States with a correlation coefficient (R) of 0.240 and weighted average of 9.0%, a difference of 10.3%.
Unemployment Among Seniors over 75 years Correlation Summary
| Measurement | Immigrants from Netherlands | Immigrants from Western Asia |
| Minimum | 6.8% | 1.0% |
| Maximum | 100.0% | 50.0% |
| Range | 93.2% | 49.0% |
| Mean | 28.4% | 13.9% |
| Median | 18.2% | 10.0% |
| Interquartile 25% (IQ1) | 11.7% | 7.4% |
| Interquartile 75% (IQ3) | 43.0% | 12.5% |
| Interquartile Range (IQR) | 31.3% | 5.0% |
| Standard Deviation (Sample) | 24.4% | 11.2% |
| Standard Deviation (Population) | 23.6% | 11.0% |
Similar Demographics by Unemployment Among Seniors over 75 years
Demographics Similar to Immigrants from Netherlands by Unemployment Among Seniors over 75 years
In terms of unemployment among seniors over 75 years, the demographic groups most similar to Immigrants from Netherlands are Immigrants from Ireland (8.1%, a difference of 0.030%), Venezuelan (8.1%, a difference of 0.080%), Egyptian (8.1%, a difference of 0.090%), Immigrants from Vietnam (8.1%, a difference of 0.13%), and Immigrants from Korea (8.1%, a difference of 0.21%).
| Demographics | Rating | Rank | Unemployment Among Seniors over 75 years |
| Immigrants | Singapore | 99.7 /100 | #86 | Exceptional 8.1% |
| Basques | 99.5 /100 | #87 | Exceptional 8.1% |
| New Zealanders | 99.5 /100 | #88 | Exceptional 8.1% |
| Immigrants | Korea | 99.5 /100 | #89 | Exceptional 8.1% |
| Immigrants | Vietnam | 99.5 /100 | #90 | Exceptional 8.1% |
| Egyptians | 99.5 /100 | #91 | Exceptional 8.1% |
| Venezuelans | 99.5 /100 | #92 | Exceptional 8.1% |
| Immigrants | Netherlands | 99.5 /100 | #93 | Exceptional 8.1% |
| Immigrants | Ireland | 99.4 /100 | #94 | Exceptional 8.1% |
| Nicaraguans | 99.3 /100 | #95 | Exceptional 8.2% |
| Immigrants | Belgium | 99.3 /100 | #96 | Exceptional 8.2% |
| Immigrants | Sri Lanka | 99.3 /100 | #97 | Exceptional 8.2% |
| Immigrants | Northern Africa | 99.3 /100 | #98 | Exceptional 8.2% |
| Burmese | 99.2 /100 | #99 | Exceptional 8.2% |
| Immigrants | Kazakhstan | 99.2 /100 | #100 | Exceptional 8.2% |
Demographics Similar to Immigrants from Western Asia by Unemployment Among Seniors over 75 years
In terms of unemployment among seniors over 75 years, the demographic groups most similar to Immigrants from Western Asia are Immigrants from Oceania (9.0%, a difference of 0.080%), Immigrants from Brazil (9.0%, a difference of 0.090%), Immigrants from Latin America (9.0%, a difference of 0.11%), Romanian (9.0%, a difference of 0.15%), and Lebanese (9.0%, a difference of 0.18%).
| Demographics | Rating | Rank | Unemployment Among Seniors over 75 years |
| Immigrants | Philippines | 15.8 /100 | #208 | Poor 8.9% |
| Salvadorans | 15.4 /100 | #209 | Poor 8.9% |
| Bermudans | 15.0 /100 | #210 | Poor 8.9% |
| Delaware | 14.6 /100 | #211 | Poor 9.0% |
| Romanians | 13.8 /100 | #212 | Poor 9.0% |
| Immigrants | Latin America | 13.4 /100 | #213 | Poor 9.0% |
| Immigrants | Brazil | 13.3 /100 | #214 | Poor 9.0% |
| Immigrants | Western Asia | 12.5 /100 | #215 | Poor 9.0% |
| Immigrants | Oceania | 11.8 /100 | #216 | Poor 9.0% |
| Lebanese | 11.1 /100 | #217 | Poor 9.0% |
| Immigrants | Africa | 9.7 /100 | #218 | Tragic 9.0% |
| Afghans | 8.3 /100 | #219 | Tragic 9.0% |
| Immigrants | Zimbabwe | 7.8 /100 | #220 | Tragic 9.0% |
| Guamanians/Chamorros | 7.7 /100 | #221 | Tragic 9.0% |
| Peruvians | 7.3 /100 | #222 | Tragic 9.0% |