Immigrants from Malaysia vs Belgian Unemployment Among Ages 20 to 24 years
COMPARE
Immigrants from Malaysia
Belgian
Unemployment Among Ages 20 to 24 years
Unemployment Among Ages 20 to 24 years Comparison
Immigrants from Malaysia
Belgians
10.0%
UNEMPLOYMENT AMONG AGES 20 TO 24 YEARS
96.9/ 100
METRIC RATING
93rd/ 347
METRIC RANK
9.6%
UNEMPLOYMENT AMONG AGES 20 TO 24 YEARS
100.0/ 100
METRIC RATING
36th/ 347
METRIC RANK
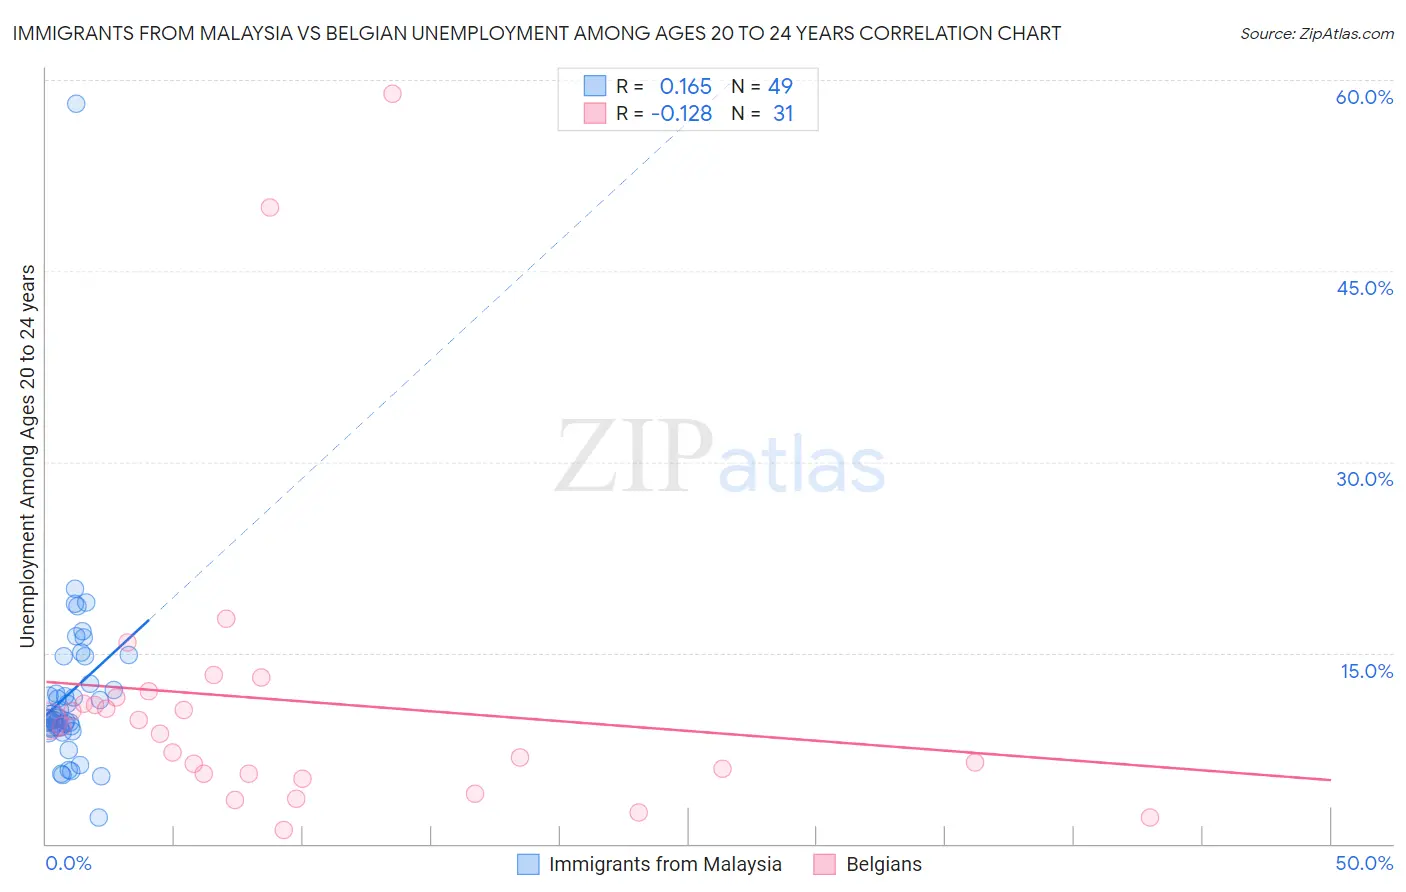
Immigrants from Malaysia vs Belgian Unemployment Among Ages 20 to 24 years Correlation Chart
The statistical analysis conducted on geographies consisting of 195,494,408 people shows a poor positive correlation between the proportion of Immigrants from Malaysia and unemployment rate among population between the ages 20 and 24 in the United States with a correlation coefficient (R) of 0.165 and weighted average of 10.0%. Similarly, the statistical analysis conducted on geographies consisting of 342,879,966 people shows a poor negative correlation between the proportion of Belgians and unemployment rate among population between the ages 20 and 24 in the United States with a correlation coefficient (R) of -0.128 and weighted average of 9.6%, a difference of 4.2%.
Unemployment Among Ages 20 to 24 years Correlation Summary
| Measurement | Immigrants from Malaysia | Belgian |
| Minimum | 2.1% | 1.1% |
| Maximum | 58.1% | 58.9% |
| Range | 56.0% | 57.8% |
| Mean | 11.9% | 11.2% |
| Median | 9.9% | 9.2% |
| Interquartile 25% (IQ1) | 9.1% | 5.5% |
| Interquartile 75% (IQ3) | 13.7% | 11.5% |
| Interquartile Range (IQR) | 4.6% | 6.0% |
| Standard Deviation (Sample) | 7.8% | 12.3% |
| Standard Deviation (Population) | 7.7% | 12.1% |
Similar Demographics by Unemployment Among Ages 20 to 24 years
Demographics Similar to Immigrants from Malaysia by Unemployment Among Ages 20 to 24 years
In terms of unemployment among ages 20 to 24 years, the demographic groups most similar to Immigrants from Malaysia are Bangladeshi (10.0%, a difference of 0.010%), Bhutanese (10.0%, a difference of 0.020%), Macedonian (10.0%, a difference of 0.050%), Chilean (10.0%, a difference of 0.050%), and Polish (10.0%, a difference of 0.070%).
| Demographics | Rating | Rank | Unemployment Among Ages 20 to 24 years |
| Immigrants | Vietnam | 97.5 /100 | #86 | Exceptional 10.0% |
| Immigrants | Oceania | 97.4 /100 | #87 | Exceptional 10.0% |
| Poles | 97.1 /100 | #88 | Exceptional 10.0% |
| Macedonians | 97.0 /100 | #89 | Exceptional 10.0% |
| Chileans | 97.0 /100 | #90 | Exceptional 10.0% |
| Bhutanese | 96.9 /100 | #91 | Exceptional 10.0% |
| Bangladeshis | 96.9 /100 | #92 | Exceptional 10.0% |
| Immigrants | Malaysia | 96.9 /100 | #93 | Exceptional 10.0% |
| Immigrants | Micronesia | 96.6 /100 | #94 | Exceptional 10.0% |
| Scotch-Irish | 96.2 /100 | #95 | Exceptional 10.0% |
| Thais | 96.2 /100 | #96 | Exceptional 10.0% |
| Slavs | 96.1 /100 | #97 | Exceptional 10.0% |
| Japanese | 95.4 /100 | #98 | Exceptional 10.0% |
| Fijians | 95.3 /100 | #99 | Exceptional 10.0% |
| Immigrants | France | 95.2 /100 | #100 | Exceptional 10.0% |
Demographics Similar to Belgians by Unemployment Among Ages 20 to 24 years
In terms of unemployment among ages 20 to 24 years, the demographic groups most similar to Belgians are German (9.6%, a difference of 0.030%), Immigrants from Zaire (9.6%, a difference of 0.080%), Yugoslavian (9.6%, a difference of 0.11%), Afghan (9.6%, a difference of 0.15%), and Australian (9.6%, a difference of 0.31%).
| Demographics | Rating | Rank | Unemployment Among Ages 20 to 24 years |
| Immigrants | North Macedonia | 100.0 /100 | #29 | Exceptional 9.5% |
| Scandinavians | 100.0 /100 | #30 | Exceptional 9.5% |
| Immigrants | Eastern Africa | 100.0 /100 | #31 | Exceptional 9.5% |
| Cambodians | 100.0 /100 | #32 | Exceptional 9.5% |
| Australians | 100.0 /100 | #33 | Exceptional 9.6% |
| Yugoslavians | 100.0 /100 | #34 | Exceptional 9.6% |
| Germans | 100.0 /100 | #35 | Exceptional 9.6% |
| Belgians | 100.0 /100 | #36 | Exceptional 9.6% |
| Immigrants | Zaire | 100.0 /100 | #37 | Exceptional 9.6% |
| Afghans | 99.9 /100 | #38 | Exceptional 9.6% |
| Dutch | 99.9 /100 | #39 | Exceptional 9.6% |
| Immigrants | Ethiopia | 99.9 /100 | #40 | Exceptional 9.6% |
| Swiss | 99.9 /100 | #41 | Exceptional 9.7% |
| Immigrants | Saudi Arabia | 99.9 /100 | #42 | Exceptional 9.7% |
| Menominee | 99.8 /100 | #43 | Exceptional 9.7% |