Immigrants from West Indies vs Icelander Unemployment Among Ages 20 to 24 years
COMPARE
Immigrants from West Indies
Icelander
Unemployment Among Ages 20 to 24 years
Unemployment Among Ages 20 to 24 years Comparison
Immigrants from West Indies
Icelanders
12.3%
UNEMPLOYMENT AMONG AGES 20 TO 24 YEARS
0.0/ 100
METRIC RATING
304th/ 347
METRIC RANK
9.9%
UNEMPLOYMENT AMONG AGES 20 TO 24 YEARS
98.3/ 100
METRIC RATING
79th/ 347
METRIC RANK
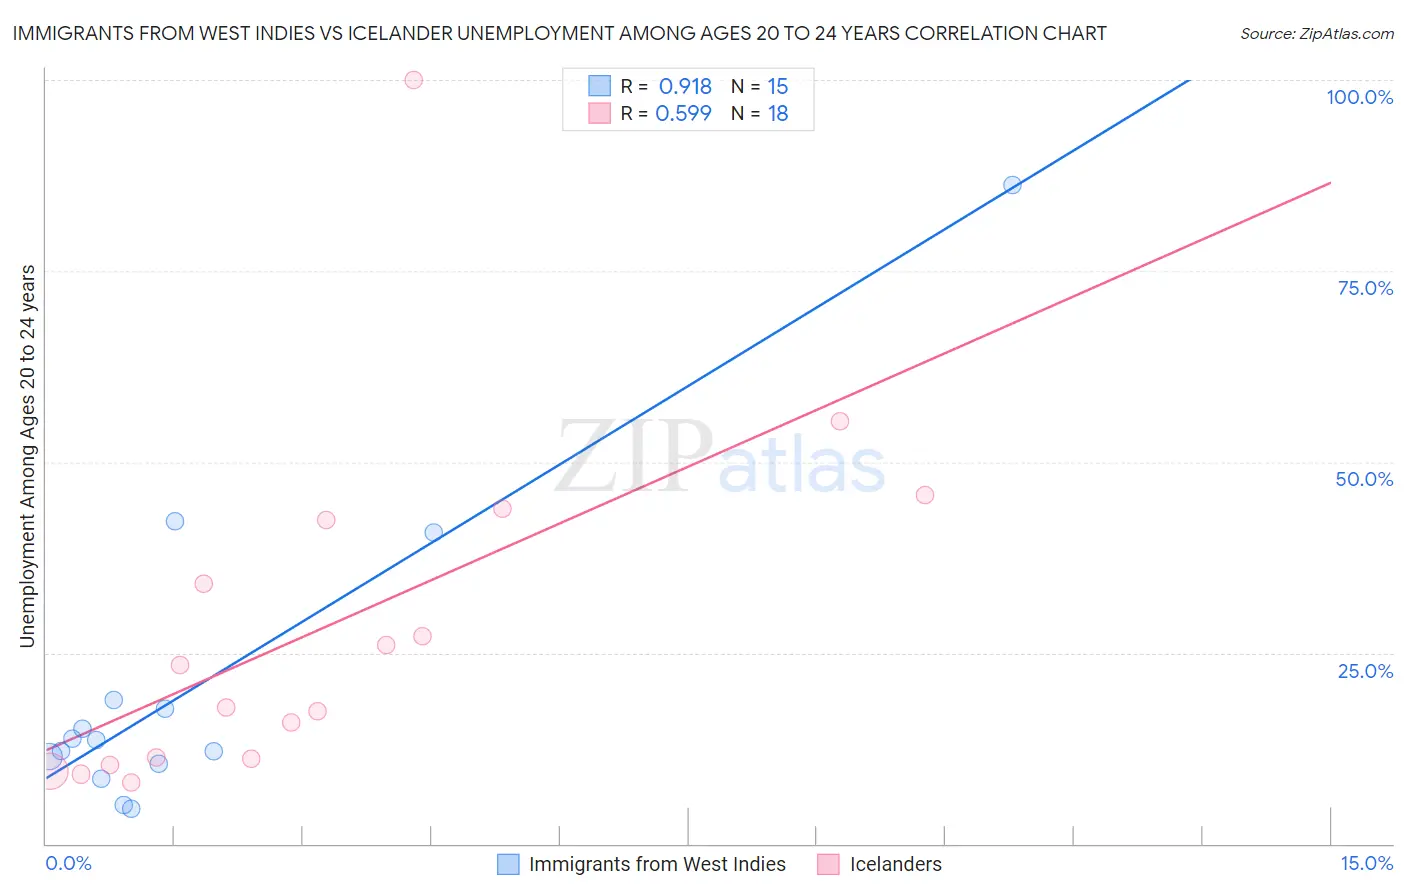
Immigrants from West Indies vs Icelander Unemployment Among Ages 20 to 24 years Correlation Chart
The statistical analysis conducted on geographies consisting of 72,183,037 people shows a near-perfect positive correlation between the proportion of Immigrants from West Indies and unemployment rate among population between the ages 20 and 24 in the United States with a correlation coefficient (R) of 0.918 and weighted average of 12.3%. Similarly, the statistical analysis conducted on geographies consisting of 156,553,400 people shows a substantial positive correlation between the proportion of Icelanders and unemployment rate among population between the ages 20 and 24 in the United States with a correlation coefficient (R) of 0.599 and weighted average of 9.9%, a difference of 23.9%.
Unemployment Among Ages 20 to 24 years Correlation Summary
| Measurement | Immigrants from West Indies | Icelander |
| Minimum | 4.6% | 8.0% |
| Maximum | 86.2% | 100.0% |
| Range | 81.6% | 92.0% |
| Mean | 20.8% | 28.2% |
| Median | 13.6% | 20.7% |
| Interquartile 25% (IQ1) | 10.5% | 11.1% |
| Interquartile 75% (IQ3) | 18.8% | 42.4% |
| Interquartile Range (IQR) | 8.2% | 31.3% |
| Standard Deviation (Sample) | 21.2% | 23.1% |
| Standard Deviation (Population) | 20.5% | 22.5% |
Similar Demographics by Unemployment Among Ages 20 to 24 years
Demographics Similar to Immigrants from West Indies by Unemployment Among Ages 20 to 24 years
In terms of unemployment among ages 20 to 24 years, the demographic groups most similar to Immigrants from West Indies are Chippewa (12.3%, a difference of 0.040%), Haitian (12.2%, a difference of 0.59%), Immigrants from Cabo Verde (12.2%, a difference of 0.61%), Immigrants from Haiti (12.4%, a difference of 0.88%), and Bermudan (12.5%, a difference of 1.3%).
| Demographics | Rating | Rank | Unemployment Among Ages 20 to 24 years |
| Blackfeet | 0.0 /100 | #297 | Tragic 12.0% |
| Lumbee | 0.0 /100 | #298 | Tragic 12.0% |
| Apache | 0.0 /100 | #299 | Tragic 12.0% |
| Spanish American Indians | 0.0 /100 | #300 | Tragic 12.1% |
| Immigrants | Sierra Leone | 0.0 /100 | #301 | Tragic 12.1% |
| Immigrants | Cabo Verde | 0.0 /100 | #302 | Tragic 12.2% |
| Haitians | 0.0 /100 | #303 | Tragic 12.2% |
| Immigrants | West Indies | 0.0 /100 | #304 | Tragic 12.3% |
| Chippewa | 0.0 /100 | #305 | Tragic 12.3% |
| Immigrants | Haiti | 0.0 /100 | #306 | Tragic 12.4% |
| Bermudans | 0.0 /100 | #307 | Tragic 12.5% |
| Tohono O'odham | 0.0 /100 | #308 | Tragic 12.5% |
| Immigrants | Bangladesh | 0.0 /100 | #309 | Tragic 12.6% |
| Jamaicans | 0.0 /100 | #310 | Tragic 12.6% |
| Vietnamese | 0.0 /100 | #311 | Tragic 12.6% |
Demographics Similar to Icelanders by Unemployment Among Ages 20 to 24 years
In terms of unemployment among ages 20 to 24 years, the demographic groups most similar to Icelanders are Assyrian/Chaldean/Syriac (9.9%, a difference of 0.020%), Immigrants from Netherlands (9.9%, a difference of 0.040%), Chickasaw (9.9%, a difference of 0.050%), Czechoslovakian (9.9%, a difference of 0.070%), and Immigrants from Australia (9.9%, a difference of 0.16%).
| Demographics | Rating | Rank | Unemployment Among Ages 20 to 24 years |
| Bolivians | 98.9 /100 | #72 | Exceptional 9.9% |
| Kenyans | 98.7 /100 | #73 | Exceptional 9.9% |
| Immigrants | Laos | 98.7 /100 | #74 | Exceptional 9.9% |
| Immigrants | Australia | 98.6 /100 | #75 | Exceptional 9.9% |
| Czechoslovakians | 98.4 /100 | #76 | Exceptional 9.9% |
| Chickasaw | 98.4 /100 | #77 | Exceptional 9.9% |
| Assyrians/Chaldeans/Syriacs | 98.3 /100 | #78 | Exceptional 9.9% |
| Icelanders | 98.3 /100 | #79 | Exceptional 9.9% |
| Immigrants | Netherlands | 98.2 /100 | #80 | Exceptional 9.9% |
| Yaqui | 98.0 /100 | #81 | Exceptional 9.9% |
| Sri Lankans | 98.0 /100 | #82 | Exceptional 9.9% |
| Immigrants | Bulgaria | 98.0 /100 | #83 | Exceptional 9.9% |
| Latvians | 97.9 /100 | #84 | Exceptional 9.9% |
| New Zealanders | 97.8 /100 | #85 | Exceptional 9.9% |
| Immigrants | Vietnam | 97.5 /100 | #86 | Exceptional 10.0% |