Immigrants from West Indies vs Luxembourger Unemployment Among Ages 30 to 34 years
COMPARE
Immigrants from West Indies
Luxembourger
Unemployment Among Ages 30 to 34 years
Unemployment Among Ages 30 to 34 years Comparison
Immigrants from West Indies
Luxembourgers
6.4%
UNEMPLOYMENT AMONG AGES 30 TO 34 YEARS
0.0/ 100
METRIC RATING
287th/ 347
METRIC RANK
4.8%
UNEMPLOYMENT AMONG AGES 30 TO 34 YEARS
99.9/ 100
METRIC RATING
14th/ 347
METRIC RANK
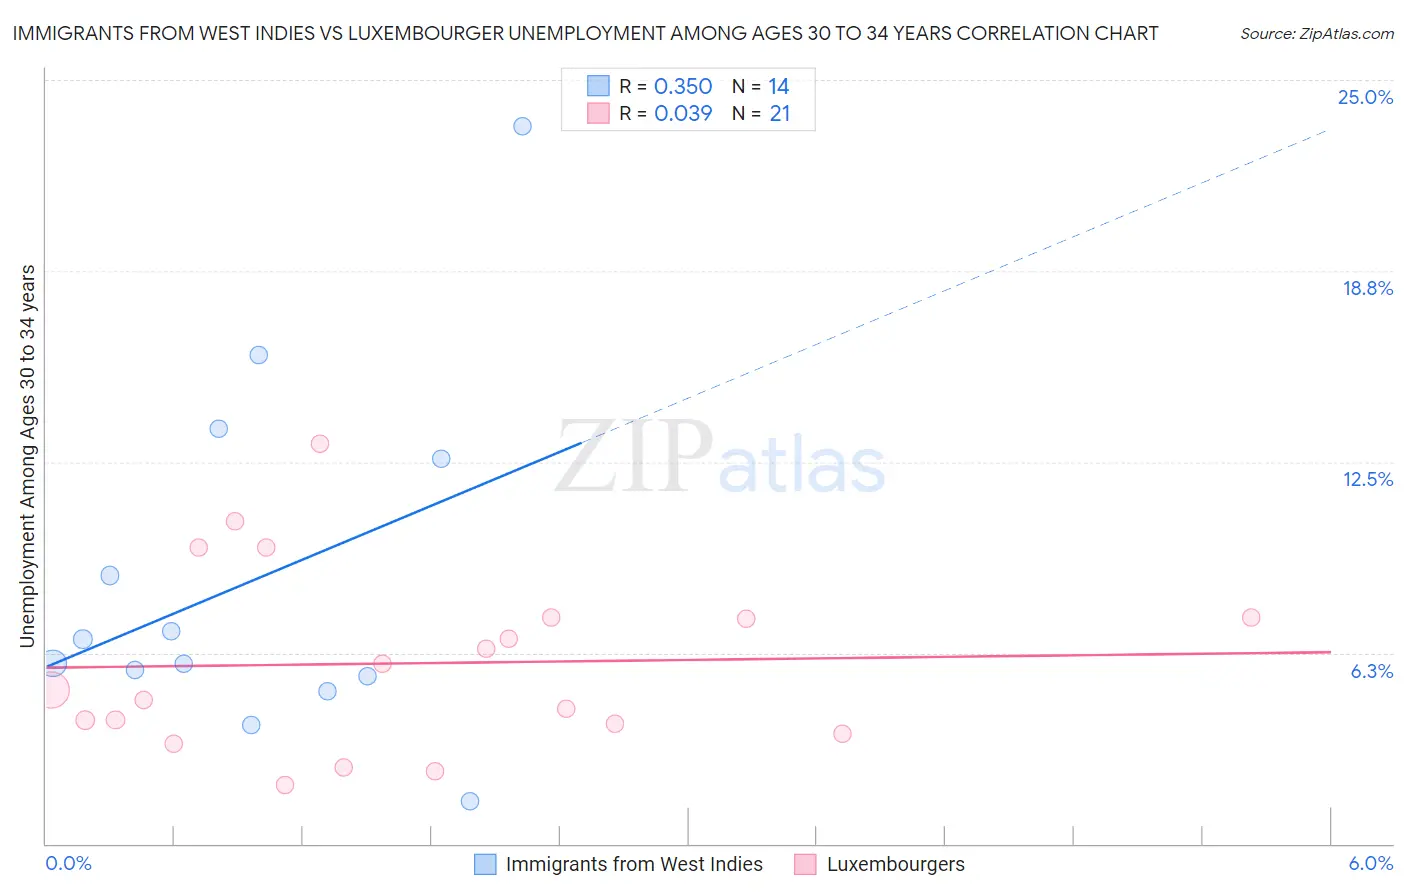
Immigrants from West Indies vs Luxembourger Unemployment Among Ages 30 to 34 years Correlation Chart
The statistical analysis conducted on geographies consisting of 71,825,237 people shows a mild positive correlation between the proportion of Immigrants from West Indies and unemployment rate among population between the ages 30 and 34 in the United States with a correlation coefficient (R) of 0.350 and weighted average of 6.4%. Similarly, the statistical analysis conducted on geographies consisting of 138,345,436 people shows no correlation between the proportion of Luxembourgers and unemployment rate among population between the ages 30 and 34 in the United States with a correlation coefficient (R) of 0.039 and weighted average of 4.8%, a difference of 33.7%.
Unemployment Among Ages 30 to 34 years Correlation Summary
| Measurement | Immigrants from West Indies | Luxembourger |
| Minimum | 1.4% | 1.9% |
| Maximum | 23.5% | 13.1% |
| Range | 22.1% | 11.2% |
| Mean | 8.7% | 5.9% |
| Median | 6.3% | 5.0% |
| Interquartile 25% (IQ1) | 5.5% | 3.8% |
| Interquartile 75% (IQ3) | 12.6% | 7.4% |
| Interquartile Range (IQR) | 7.1% | 3.6% |
| Standard Deviation (Sample) | 5.8% | 3.0% |
| Standard Deviation (Population) | 5.6% | 2.9% |
Similar Demographics by Unemployment Among Ages 30 to 34 years
Demographics Similar to Immigrants from West Indies by Unemployment Among Ages 30 to 34 years
In terms of unemployment among ages 30 to 34 years, the demographic groups most similar to Immigrants from West Indies are Central American Indian (6.4%, a difference of 0.020%), Senegalese (6.4%, a difference of 0.040%), Choctaw (6.4%, a difference of 0.060%), Menominee (6.4%, a difference of 0.080%), and Immigrants from Bangladesh (6.4%, a difference of 0.17%).
| Demographics | Rating | Rank | Unemployment Among Ages 30 to 34 years |
| Cherokee | 0.0 /100 | #280 | Tragic 6.4% |
| Immigrants | Caribbean | 0.0 /100 | #281 | Tragic 6.4% |
| Africans | 0.0 /100 | #282 | Tragic 6.4% |
| Hispanics or Latinos | 0.0 /100 | #283 | Tragic 6.4% |
| Immigrants | Bangladesh | 0.0 /100 | #284 | Tragic 6.4% |
| Choctaw | 0.0 /100 | #285 | Tragic 6.4% |
| Central American Indians | 0.0 /100 | #286 | Tragic 6.4% |
| Immigrants | West Indies | 0.0 /100 | #287 | Tragic 6.4% |
| Senegalese | 0.0 /100 | #288 | Tragic 6.4% |
| Menominee | 0.0 /100 | #289 | Tragic 6.4% |
| Immigrants | Trinidad and Tobago | 0.0 /100 | #290 | Tragic 6.5% |
| Jamaicans | 0.0 /100 | #291 | Tragic 6.5% |
| Vietnamese | 0.0 /100 | #292 | Tragic 6.5% |
| West Indians | 0.0 /100 | #293 | Tragic 6.5% |
| Barbadians | 0.0 /100 | #294 | Tragic 6.5% |
Demographics Similar to Luxembourgers by Unemployment Among Ages 30 to 34 years
In terms of unemployment among ages 30 to 34 years, the demographic groups most similar to Luxembourgers are Filipino (4.8%, a difference of 0.010%), Cambodian (4.8%, a difference of 0.010%), Okinawan (4.8%, a difference of 0.37%), Zimbabwean (4.8%, a difference of 0.48%), and Immigrants from Bulgaria (4.8%, a difference of 0.59%).
| Demographics | Rating | Rank | Unemployment Among Ages 30 to 34 years |
| Thais | 100.0 /100 | #7 | Exceptional 4.7% |
| Immigrants | Eritrea | 100.0 /100 | #8 | Exceptional 4.7% |
| Bulgarians | 99.9 /100 | #9 | Exceptional 4.7% |
| Tongans | 99.9 /100 | #10 | Exceptional 4.8% |
| Immigrants | Bolivia | 99.9 /100 | #11 | Exceptional 4.8% |
| Filipinos | 99.9 /100 | #12 | Exceptional 4.8% |
| Cambodians | 99.9 /100 | #13 | Exceptional 4.8% |
| Luxembourgers | 99.9 /100 | #14 | Exceptional 4.8% |
| Okinawans | 99.9 /100 | #15 | Exceptional 4.8% |
| Zimbabweans | 99.9 /100 | #16 | Exceptional 4.8% |
| Immigrants | Bulgaria | 99.9 /100 | #17 | Exceptional 4.8% |
| Bolivians | 99.8 /100 | #18 | Exceptional 4.9% |
| Immigrants | Sudan | 99.8 /100 | #19 | Exceptional 4.9% |
| Immigrants | Taiwan | 99.8 /100 | #20 | Exceptional 4.9% |
| Ethiopians | 99.8 /100 | #21 | Exceptional 4.9% |