Immigrants from West Indies vs Immigrants from Ecuador Male Unemployment
COMPARE
Immigrants from West Indies
Immigrants from Ecuador
Male Unemployment
Male Unemployment Comparison
Immigrants from West Indies
Immigrants from Ecuador
6.7%
MALE UNEMPLOYMENT
0.0/ 100
METRIC RATING
303rd/ 347
METRIC RANK
6.2%
MALE UNEMPLOYMENT
0.0/ 100
METRIC RATING
285th/ 347
METRIC RANK
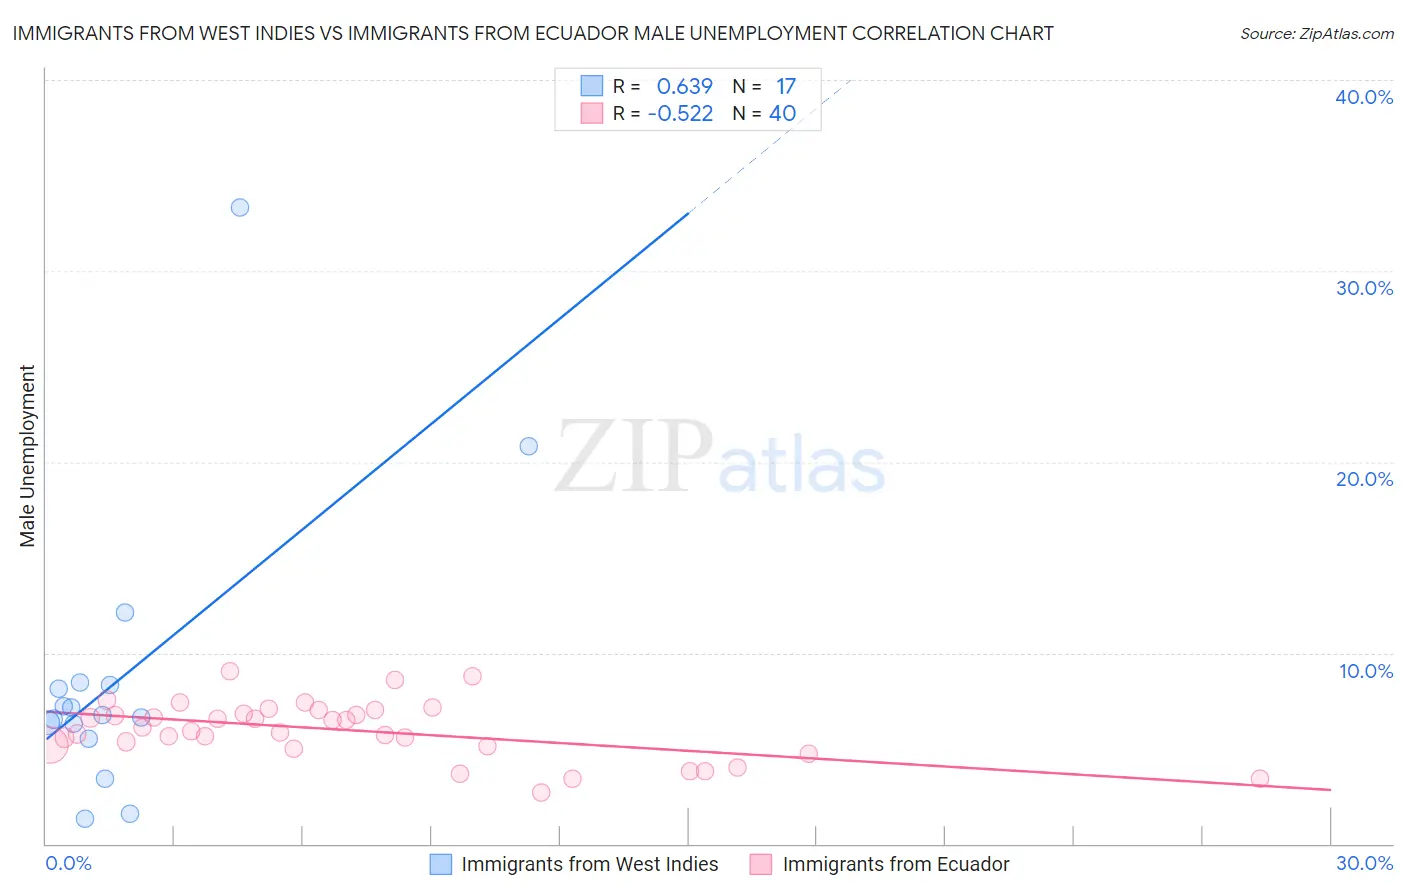
Immigrants from West Indies vs Immigrants from Ecuador Male Unemployment Correlation Chart
The statistical analysis conducted on geographies consisting of 72,422,402 people shows a significant positive correlation between the proportion of Immigrants from West Indies and unemployment rate among males in the United States with a correlation coefficient (R) of 0.639 and weighted average of 6.7%. Similarly, the statistical analysis conducted on geographies consisting of 270,419,608 people shows a substantial negative correlation between the proportion of Immigrants from Ecuador and unemployment rate among males in the United States with a correlation coefficient (R) of -0.522 and weighted average of 6.2%, a difference of 6.9%.
Male Unemployment Correlation Summary
| Measurement | Immigrants from West Indies | Immigrants from Ecuador |
| Minimum | 1.3% | 2.7% |
| Maximum | 33.3% | 9.0% |
| Range | 32.0% | 6.3% |
| Mean | 8.8% | 6.0% |
| Median | 6.7% | 6.0% |
| Interquartile 25% (IQ1) | 5.9% | 5.2% |
| Interquartile 75% (IQ3) | 8.4% | 6.9% |
| Interquartile Range (IQR) | 2.5% | 1.7% |
| Standard Deviation (Sample) | 7.7% | 1.5% |
| Standard Deviation (Population) | 7.4% | 1.5% |
Demographics Similar to Immigrants from West Indies and Immigrants from Ecuador by Male Unemployment
In terms of male unemployment, the demographic groups most similar to Immigrants from West Indies are West Indian (6.7%, a difference of 0.0%), Ute (6.6%, a difference of 0.36%), Immigrants from Belize (6.6%, a difference of 1.1%), Vietnamese (6.6%, a difference of 1.2%), and Immigrants from Bangladesh (6.6%, a difference of 1.5%). Similarly, the demographic groups most similar to Immigrants from Ecuador are Spanish American Indian (6.2%, a difference of 0.020%), African (6.3%, a difference of 0.43%), Central American Indian (6.3%, a difference of 0.72%), Immigrants from Senegal (6.3%, a difference of 0.76%), and Immigrants from Caribbean (6.3%, a difference of 0.88%).
| Demographics | Rating | Rank | Male Unemployment |
| Spanish American Indians | 0.0 /100 | #284 | Tragic 6.2% |
| Immigrants | Ecuador | 0.0 /100 | #285 | Tragic 6.2% |
| Africans | 0.0 /100 | #286 | Tragic 6.3% |
| Central American Indians | 0.0 /100 | #287 | Tragic 6.3% |
| Immigrants | Senegal | 0.0 /100 | #288 | Tragic 6.3% |
| Immigrants | Caribbean | 0.0 /100 | #289 | Tragic 6.3% |
| U.S. Virgin Islanders | 0.0 /100 | #290 | Tragic 6.4% |
| Immigrants | Azores | 0.0 /100 | #291 | Tragic 6.4% |
| Nepalese | 0.0 /100 | #292 | Tragic 6.4% |
| Haitians | 0.0 /100 | #293 | Tragic 6.4% |
| Senegalese | 0.0 /100 | #294 | Tragic 6.4% |
| Belizeans | 0.0 /100 | #295 | Tragic 6.5% |
| Immigrants | Haiti | 0.0 /100 | #296 | Tragic 6.5% |
| Chippewa | 0.0 /100 | #297 | Tragic 6.6% |
| Jamaicans | 0.0 /100 | #298 | Tragic 6.6% |
| Immigrants | Bangladesh | 0.0 /100 | #299 | Tragic 6.6% |
| Vietnamese | 0.0 /100 | #300 | Tragic 6.6% |
| Immigrants | Belize | 0.0 /100 | #301 | Tragic 6.6% |
| Ute | 0.0 /100 | #302 | Tragic 6.6% |
| Immigrants | West Indies | 0.0 /100 | #303 | Tragic 6.7% |
| West Indians | 0.0 /100 | #304 | Tragic 6.7% |