Immigrants from Vietnam vs Immigrants from Thailand Unemployment Among Ages 20 to 24 years
COMPARE
Immigrants from Vietnam
Immigrants from Thailand
Unemployment Among Ages 20 to 24 years
Unemployment Among Ages 20 to 24 years Comparison
Immigrants from Vietnam
Immigrants from Thailand
10.0%
UNEMPLOYMENT AMONG AGES 20 TO 24 YEARS
97.5/ 100
METRIC RATING
86th/ 347
METRIC RANK
9.8%
UNEMPLOYMENT AMONG AGES 20 TO 24 YEARS
99.7/ 100
METRIC RATING
52nd/ 347
METRIC RANK
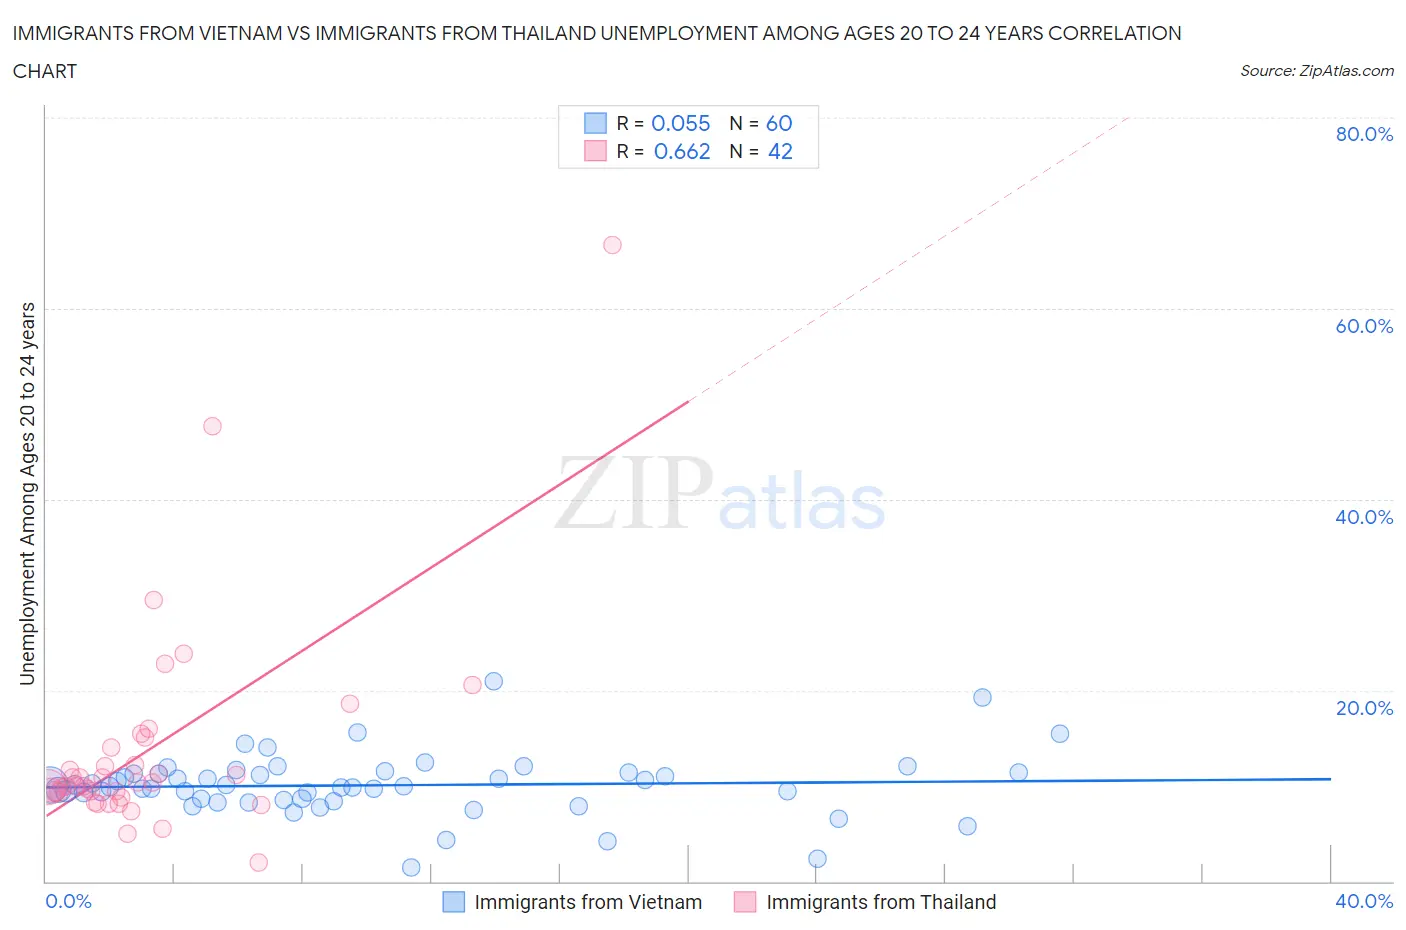
Immigrants from Vietnam vs Immigrants from Thailand Unemployment Among Ages 20 to 24 years Correlation Chart
The statistical analysis conducted on geographies consisting of 394,527,292 people shows a slight positive correlation between the proportion of Immigrants from Vietnam and unemployment rate among population between the ages 20 and 24 in the United States with a correlation coefficient (R) of 0.055 and weighted average of 10.0%. Similarly, the statistical analysis conducted on geographies consisting of 310,911,339 people shows a significant positive correlation between the proportion of Immigrants from Thailand and unemployment rate among population between the ages 20 and 24 in the United States with a correlation coefficient (R) of 0.662 and weighted average of 9.8%, a difference of 2.0%.
Unemployment Among Ages 20 to 24 years Correlation Summary
| Measurement | Immigrants from Vietnam | Immigrants from Thailand |
| Minimum | 1.5% | 2.0% |
| Maximum | 21.0% | 66.7% |
| Range | 19.5% | 64.7% |
| Mean | 10.1% | 13.7% |
| Median | 10.0% | 10.2% |
| Interquartile 25% (IQ1) | 8.6% | 9.3% |
| Interquartile 75% (IQ3) | 11.3% | 14.0% |
| Interquartile Range (IQR) | 2.8% | 4.6% |
| Standard Deviation (Sample) | 3.2% | 11.3% |
| Standard Deviation (Population) | 3.2% | 11.1% |
Similar Demographics by Unemployment Among Ages 20 to 24 years
Demographics Similar to Immigrants from Vietnam by Unemployment Among Ages 20 to 24 years
In terms of unemployment among ages 20 to 24 years, the demographic groups most similar to Immigrants from Vietnam are Immigrants from Oceania (10.0%, a difference of 0.040%), Polish (10.0%, a difference of 0.13%), New Zealander (9.9%, a difference of 0.15%), Macedonian (10.0%, a difference of 0.15%), and Chilean (10.0%, a difference of 0.15%).
| Demographics | Rating | Rank | Unemployment Among Ages 20 to 24 years |
| Icelanders | 98.3 /100 | #79 | Exceptional 9.9% |
| Immigrants | Netherlands | 98.2 /100 | #80 | Exceptional 9.9% |
| Yaqui | 98.0 /100 | #81 | Exceptional 9.9% |
| Sri Lankans | 98.0 /100 | #82 | Exceptional 9.9% |
| Immigrants | Bulgaria | 98.0 /100 | #83 | Exceptional 9.9% |
| Latvians | 97.9 /100 | #84 | Exceptional 9.9% |
| New Zealanders | 97.8 /100 | #85 | Exceptional 9.9% |
| Immigrants | Vietnam | 97.5 /100 | #86 | Exceptional 10.0% |
| Immigrants | Oceania | 97.4 /100 | #87 | Exceptional 10.0% |
| Poles | 97.1 /100 | #88 | Exceptional 10.0% |
| Macedonians | 97.0 /100 | #89 | Exceptional 10.0% |
| Chileans | 97.0 /100 | #90 | Exceptional 10.0% |
| Bhutanese | 96.9 /100 | #91 | Exceptional 10.0% |
| Bangladeshis | 96.9 /100 | #92 | Exceptional 10.0% |
| Immigrants | Malaysia | 96.9 /100 | #93 | Exceptional 10.0% |
Demographics Similar to Immigrants from Thailand by Unemployment Among Ages 20 to 24 years
In terms of unemployment among ages 20 to 24 years, the demographic groups most similar to Immigrants from Thailand are Ethiopian (9.8%, a difference of 0.11%), Immigrants from Serbia (9.8%, a difference of 0.11%), Immigrants from Cambodia (9.8%, a difference of 0.15%), Immigrants from Kenya (9.7%, a difference of 0.17%), and Carpatho Rusyn (9.8%, a difference of 0.28%).
| Demographics | Rating | Rank | Unemployment Among Ages 20 to 24 years |
| Croatians | 99.8 /100 | #45 | Exceptional 9.7% |
| Immigrants | Nicaragua | 99.8 /100 | #46 | Exceptional 9.7% |
| Immigrants | India | 99.8 /100 | #47 | Exceptional 9.7% |
| Finns | 99.8 /100 | #48 | Exceptional 9.7% |
| Creek | 99.8 /100 | #49 | Exceptional 9.7% |
| Immigrants | Kenya | 99.7 /100 | #50 | Exceptional 9.7% |
| Ethiopians | 99.7 /100 | #51 | Exceptional 9.8% |
| Immigrants | Thailand | 99.7 /100 | #52 | Exceptional 9.8% |
| Immigrants | Serbia | 99.6 /100 | #53 | Exceptional 9.8% |
| Immigrants | Cambodia | 99.6 /100 | #54 | Exceptional 9.8% |
| Carpatho Rusyns | 99.6 /100 | #55 | Exceptional 9.8% |
| Nicaraguans | 99.6 /100 | #56 | Exceptional 9.8% |
| Immigrants | Moldova | 99.5 /100 | #57 | Exceptional 9.8% |
| Pakistanis | 99.5 /100 | #58 | Exceptional 9.8% |
| English | 99.5 /100 | #59 | Exceptional 9.8% |