Guatemalan vs Immigrants from Thailand Unemployment Among Ages 20 to 24 years
COMPARE
Guatemalan
Immigrants from Thailand
Unemployment Among Ages 20 to 24 years
Unemployment Among Ages 20 to 24 years Comparison
Guatemalans
Immigrants from Thailand
10.5%
UNEMPLOYMENT AMONG AGES 20 TO 24 YEARS
12.2/ 100
METRIC RATING
213th/ 347
METRIC RANK
9.8%
UNEMPLOYMENT AMONG AGES 20 TO 24 YEARS
99.7/ 100
METRIC RATING
52nd/ 347
METRIC RANK
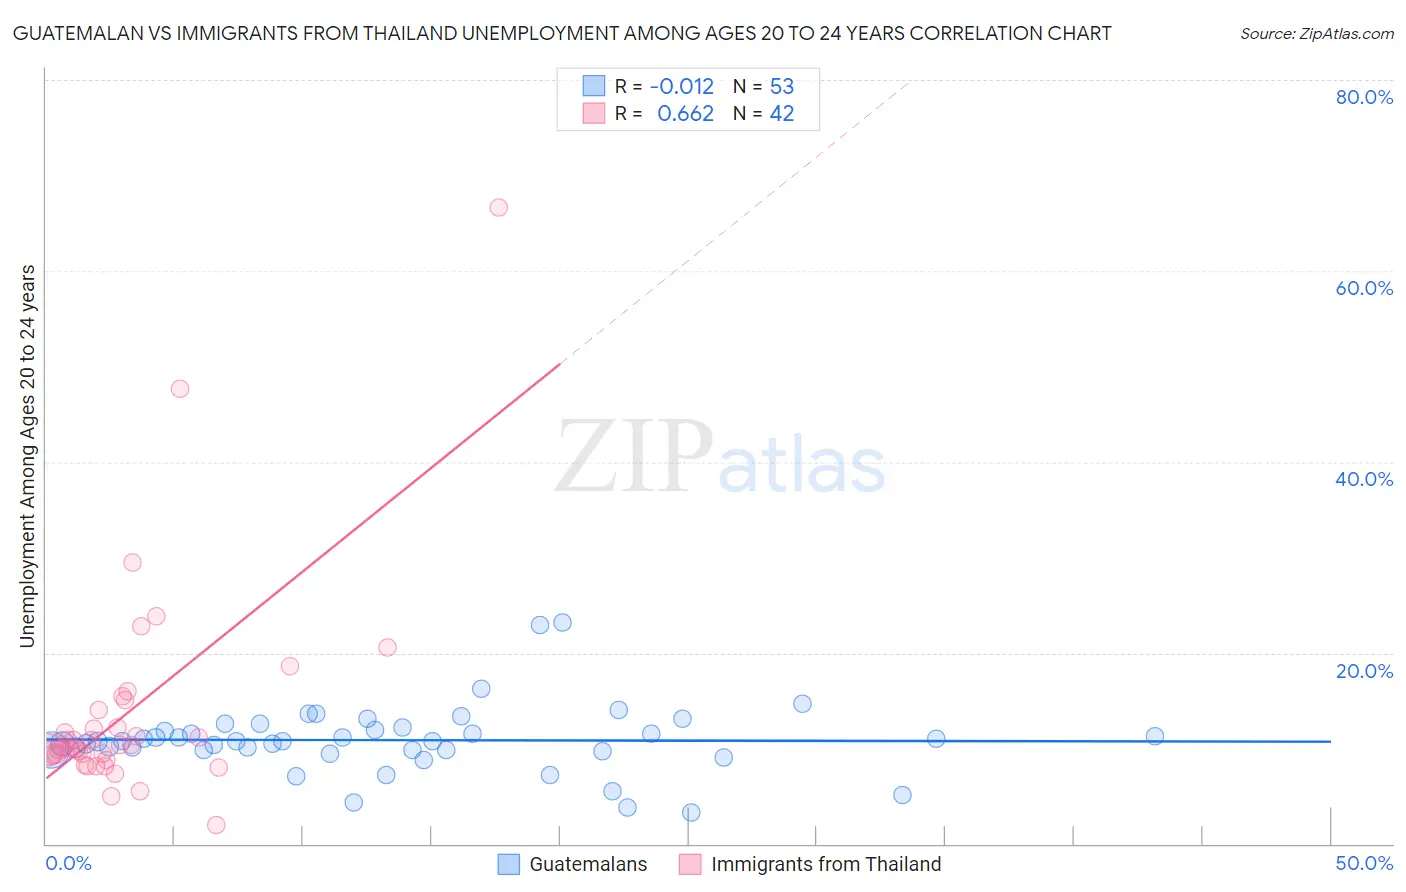
Guatemalan vs Immigrants from Thailand Unemployment Among Ages 20 to 24 years Correlation Chart
The statistical analysis conducted on geographies consisting of 397,999,155 people shows no correlation between the proportion of Guatemalans and unemployment rate among population between the ages 20 and 24 in the United States with a correlation coefficient (R) of -0.012 and weighted average of 10.5%. Similarly, the statistical analysis conducted on geographies consisting of 310,911,339 people shows a significant positive correlation between the proportion of Immigrants from Thailand and unemployment rate among population between the ages 20 and 24 in the United States with a correlation coefficient (R) of 0.662 and weighted average of 9.8%, a difference of 7.5%.
Unemployment Among Ages 20 to 24 years Correlation Summary
| Measurement | Guatemalan | Immigrants from Thailand |
| Minimum | 3.2% | 2.0% |
| Maximum | 23.2% | 66.7% |
| Range | 20.0% | 64.7% |
| Mean | 10.9% | 13.7% |
| Median | 10.7% | 10.2% |
| Interquartile 25% (IQ1) | 9.8% | 9.3% |
| Interquartile 75% (IQ3) | 12.0% | 14.0% |
| Interquartile Range (IQR) | 2.2% | 4.6% |
| Standard Deviation (Sample) | 3.6% | 11.3% |
| Standard Deviation (Population) | 3.5% | 11.1% |
Similar Demographics by Unemployment Among Ages 20 to 24 years
Demographics Similar to Guatemalans by Unemployment Among Ages 20 to 24 years
In terms of unemployment among ages 20 to 24 years, the demographic groups most similar to Guatemalans are Kiowa (10.5%, a difference of 0.040%), Immigrants from Sri Lanka (10.5%, a difference of 0.14%), Honduran (10.5%, a difference of 0.15%), Immigrants from Guatemala (10.5%, a difference of 0.19%), and Costa Rican (10.5%, a difference of 0.24%).
| Demographics | Rating | Rank | Unemployment Among Ages 20 to 24 years |
| Immigrants | Europe | 18.5 /100 | #206 | Poor 10.4% |
| Immigrants | Honduras | 17.9 /100 | #207 | Poor 10.4% |
| Immigrants | Hong Kong | 17.6 /100 | #208 | Poor 10.5% |
| Peruvians | 17.2 /100 | #209 | Poor 10.5% |
| Immigrants | Belgium | 16.9 /100 | #210 | Poor 10.5% |
| Immigrants | Guatemala | 14.6 /100 | #211 | Poor 10.5% |
| Immigrants | Sri Lanka | 14.0 /100 | #212 | Poor 10.5% |
| Guatemalans | 12.2 /100 | #213 | Poor 10.5% |
| Kiowa | 11.7 /100 | #214 | Poor 10.5% |
| Hondurans | 10.5 /100 | #215 | Poor 10.5% |
| Costa Ricans | 9.6 /100 | #216 | Tragic 10.5% |
| Cherokee | 9.3 /100 | #217 | Tragic 10.5% |
| Immigrants | Nonimmigrants | 8.8 /100 | #218 | Tragic 10.5% |
| Immigrants | Southern Europe | 8.0 /100 | #219 | Tragic 10.5% |
| Eastern Europeans | 6.9 /100 | #220 | Tragic 10.6% |
Demographics Similar to Immigrants from Thailand by Unemployment Among Ages 20 to 24 years
In terms of unemployment among ages 20 to 24 years, the demographic groups most similar to Immigrants from Thailand are Ethiopian (9.8%, a difference of 0.11%), Immigrants from Serbia (9.8%, a difference of 0.11%), Immigrants from Cambodia (9.8%, a difference of 0.15%), Immigrants from Kenya (9.7%, a difference of 0.17%), and Carpatho Rusyn (9.8%, a difference of 0.28%).
| Demographics | Rating | Rank | Unemployment Among Ages 20 to 24 years |
| Croatians | 99.8 /100 | #45 | Exceptional 9.7% |
| Immigrants | Nicaragua | 99.8 /100 | #46 | Exceptional 9.7% |
| Immigrants | India | 99.8 /100 | #47 | Exceptional 9.7% |
| Finns | 99.8 /100 | #48 | Exceptional 9.7% |
| Creek | 99.8 /100 | #49 | Exceptional 9.7% |
| Immigrants | Kenya | 99.7 /100 | #50 | Exceptional 9.7% |
| Ethiopians | 99.7 /100 | #51 | Exceptional 9.8% |
| Immigrants | Thailand | 99.7 /100 | #52 | Exceptional 9.8% |
| Immigrants | Serbia | 99.6 /100 | #53 | Exceptional 9.8% |
| Immigrants | Cambodia | 99.6 /100 | #54 | Exceptional 9.8% |
| Carpatho Rusyns | 99.6 /100 | #55 | Exceptional 9.8% |
| Nicaraguans | 99.6 /100 | #56 | Exceptional 9.8% |
| Immigrants | Moldova | 99.5 /100 | #57 | Exceptional 9.8% |
| Pakistanis | 99.5 /100 | #58 | Exceptional 9.8% |
| English | 99.5 /100 | #59 | Exceptional 9.8% |