Immigrants from Vietnam vs Immigrants from Ireland Unemployment Among Ages 20 to 24 years
COMPARE
Immigrants from Vietnam
Immigrants from Ireland
Unemployment Among Ages 20 to 24 years
Unemployment Among Ages 20 to 24 years Comparison
Immigrants from Vietnam
Immigrants from Ireland
10.0%
UNEMPLOYMENT AMONG AGES 20 TO 24 YEARS
97.5/ 100
METRIC RATING
86th/ 347
METRIC RANK
11.1%
UNEMPLOYMENT AMONG AGES 20 TO 24 YEARS
0.0/ 100
METRIC RATING
265th/ 347
METRIC RANK
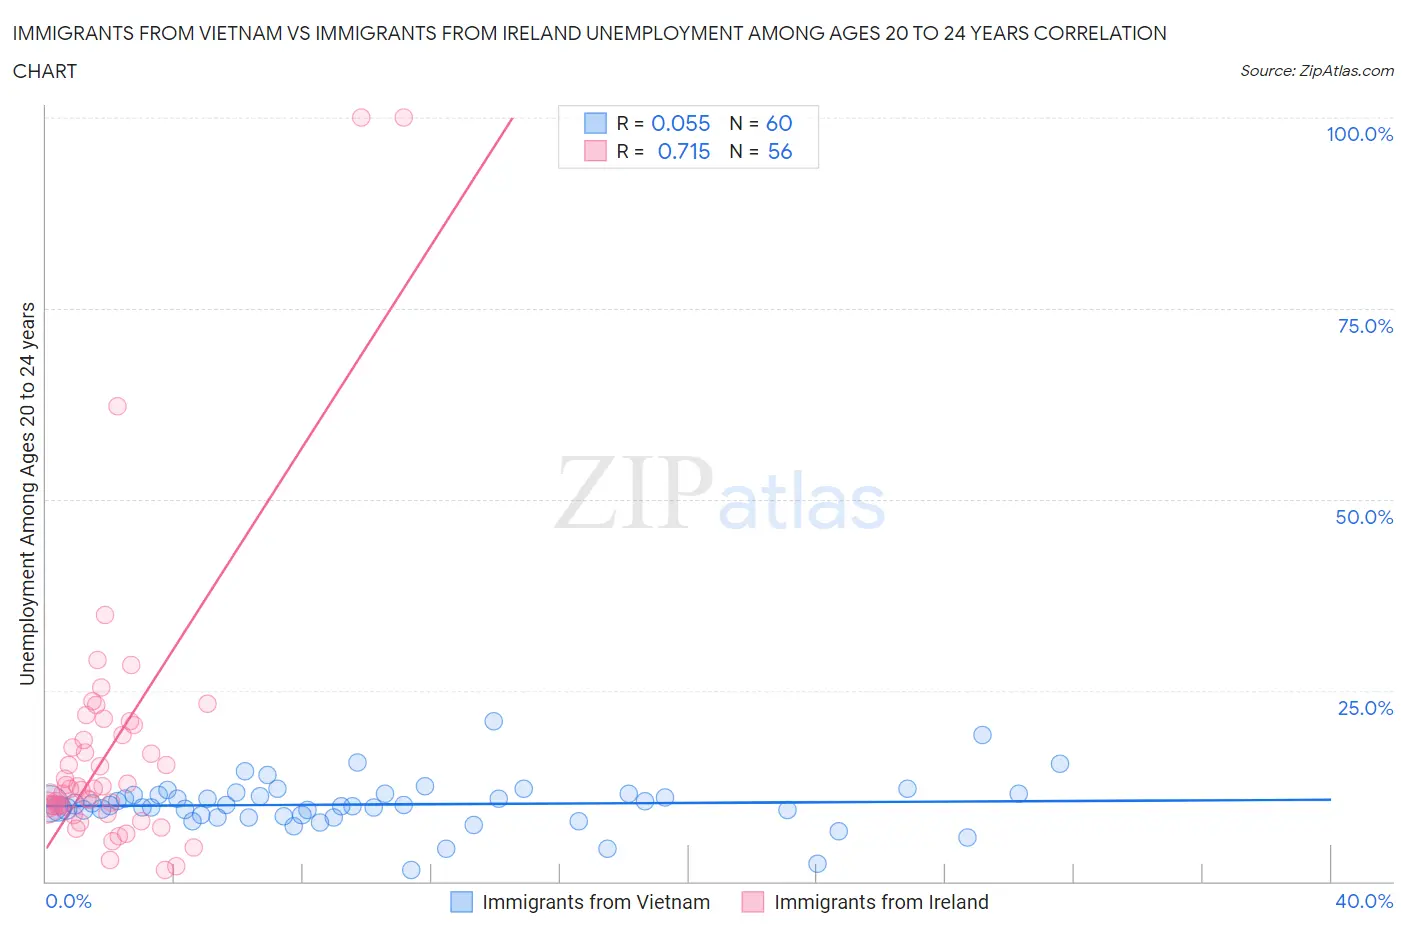
Immigrants from Vietnam vs Immigrants from Ireland Unemployment Among Ages 20 to 24 years Correlation Chart
The statistical analysis conducted on geographies consisting of 394,527,292 people shows a slight positive correlation between the proportion of Immigrants from Vietnam and unemployment rate among population between the ages 20 and 24 in the United States with a correlation coefficient (R) of 0.055 and weighted average of 10.0%. Similarly, the statistical analysis conducted on geographies consisting of 235,644,442 people shows a strong positive correlation between the proportion of Immigrants from Ireland and unemployment rate among population between the ages 20 and 24 in the United States with a correlation coefficient (R) of 0.715 and weighted average of 11.1%, a difference of 11.2%.
Unemployment Among Ages 20 to 24 years Correlation Summary
| Measurement | Immigrants from Vietnam | Immigrants from Ireland |
| Minimum | 1.5% | 1.4% |
| Maximum | 21.0% | 100.0% |
| Range | 19.5% | 98.6% |
| Mean | 10.1% | 17.4% |
| Median | 10.0% | 12.1% |
| Interquartile 25% (IQ1) | 8.6% | 9.7% |
| Interquartile 75% (IQ3) | 11.3% | 19.9% |
| Interquartile Range (IQR) | 2.8% | 10.1% |
| Standard Deviation (Sample) | 3.2% | 18.7% |
| Standard Deviation (Population) | 3.2% | 18.5% |
Similar Demographics by Unemployment Among Ages 20 to 24 years
Demographics Similar to Immigrants from Vietnam by Unemployment Among Ages 20 to 24 years
In terms of unemployment among ages 20 to 24 years, the demographic groups most similar to Immigrants from Vietnam are Immigrants from Oceania (10.0%, a difference of 0.040%), Polish (10.0%, a difference of 0.13%), New Zealander (9.9%, a difference of 0.15%), Macedonian (10.0%, a difference of 0.15%), and Chilean (10.0%, a difference of 0.15%).
| Demographics | Rating | Rank | Unemployment Among Ages 20 to 24 years |
| Icelanders | 98.3 /100 | #79 | Exceptional 9.9% |
| Immigrants | Netherlands | 98.2 /100 | #80 | Exceptional 9.9% |
| Yaqui | 98.0 /100 | #81 | Exceptional 9.9% |
| Sri Lankans | 98.0 /100 | #82 | Exceptional 9.9% |
| Immigrants | Bulgaria | 98.0 /100 | #83 | Exceptional 9.9% |
| Latvians | 97.9 /100 | #84 | Exceptional 9.9% |
| New Zealanders | 97.8 /100 | #85 | Exceptional 9.9% |
| Immigrants | Vietnam | 97.5 /100 | #86 | Exceptional 10.0% |
| Immigrants | Oceania | 97.4 /100 | #87 | Exceptional 10.0% |
| Poles | 97.1 /100 | #88 | Exceptional 10.0% |
| Macedonians | 97.0 /100 | #89 | Exceptional 10.0% |
| Chileans | 97.0 /100 | #90 | Exceptional 10.0% |
| Bhutanese | 96.9 /100 | #91 | Exceptional 10.0% |
| Bangladeshis | 96.9 /100 | #92 | Exceptional 10.0% |
| Immigrants | Malaysia | 96.9 /100 | #93 | Exceptional 10.0% |
Demographics Similar to Immigrants from Ireland by Unemployment Among Ages 20 to 24 years
In terms of unemployment among ages 20 to 24 years, the demographic groups most similar to Immigrants from Ireland are Subsaharan African (11.1%, a difference of 0.070%), Immigrants from Liberia (11.1%, a difference of 0.090%), Immigrants from Greece (11.1%, a difference of 0.37%), Marshallese (11.0%, a difference of 0.82%), and Maltese (11.2%, a difference of 0.82%).
| Demographics | Rating | Rank | Unemployment Among Ages 20 to 24 years |
| Dutch West Indians | 0.3 /100 | #258 | Tragic 10.9% |
| Panamanians | 0.2 /100 | #259 | Tragic 10.9% |
| Immigrants | Lebanon | 0.2 /100 | #260 | Tragic 10.9% |
| Puget Sound Salish | 0.2 /100 | #261 | Tragic 10.9% |
| Immigrants | Latin America | 0.1 /100 | #262 | Tragic 11.0% |
| Marshallese | 0.1 /100 | #263 | Tragic 11.0% |
| Sub-Saharan Africans | 0.0 /100 | #264 | Tragic 11.1% |
| Immigrants | Ireland | 0.0 /100 | #265 | Tragic 11.1% |
| Immigrants | Liberia | 0.0 /100 | #266 | Tragic 11.1% |
| Immigrants | Greece | 0.0 /100 | #267 | Tragic 11.1% |
| Maltese | 0.0 /100 | #268 | Tragic 11.2% |
| Ute | 0.0 /100 | #269 | Tragic 11.2% |
| Delaware | 0.0 /100 | #270 | Tragic 11.3% |
| Immigrants | Uzbekistan | 0.0 /100 | #271 | Tragic 11.4% |
| Nigerians | 0.0 /100 | #272 | Tragic 11.4% |