Eastern European vs Tsimshian Unemployment Among Ages 45 to 54 years
COMPARE
Eastern European
Tsimshian
Unemployment Among Ages 45 to 54 years
Unemployment Among Ages 45 to 54 years Comparison
Eastern Europeans
Tsimshian
4.3%
UNEMPLOYMENT AMONG AGES 45 TO 54 YEARS
97.6/ 100
METRIC RATING
82nd/ 347
METRIC RANK
4.5%
UNEMPLOYMENT AMONG AGES 45 TO 54 YEARS
74.6/ 100
METRIC RATING
150th/ 347
METRIC RANK
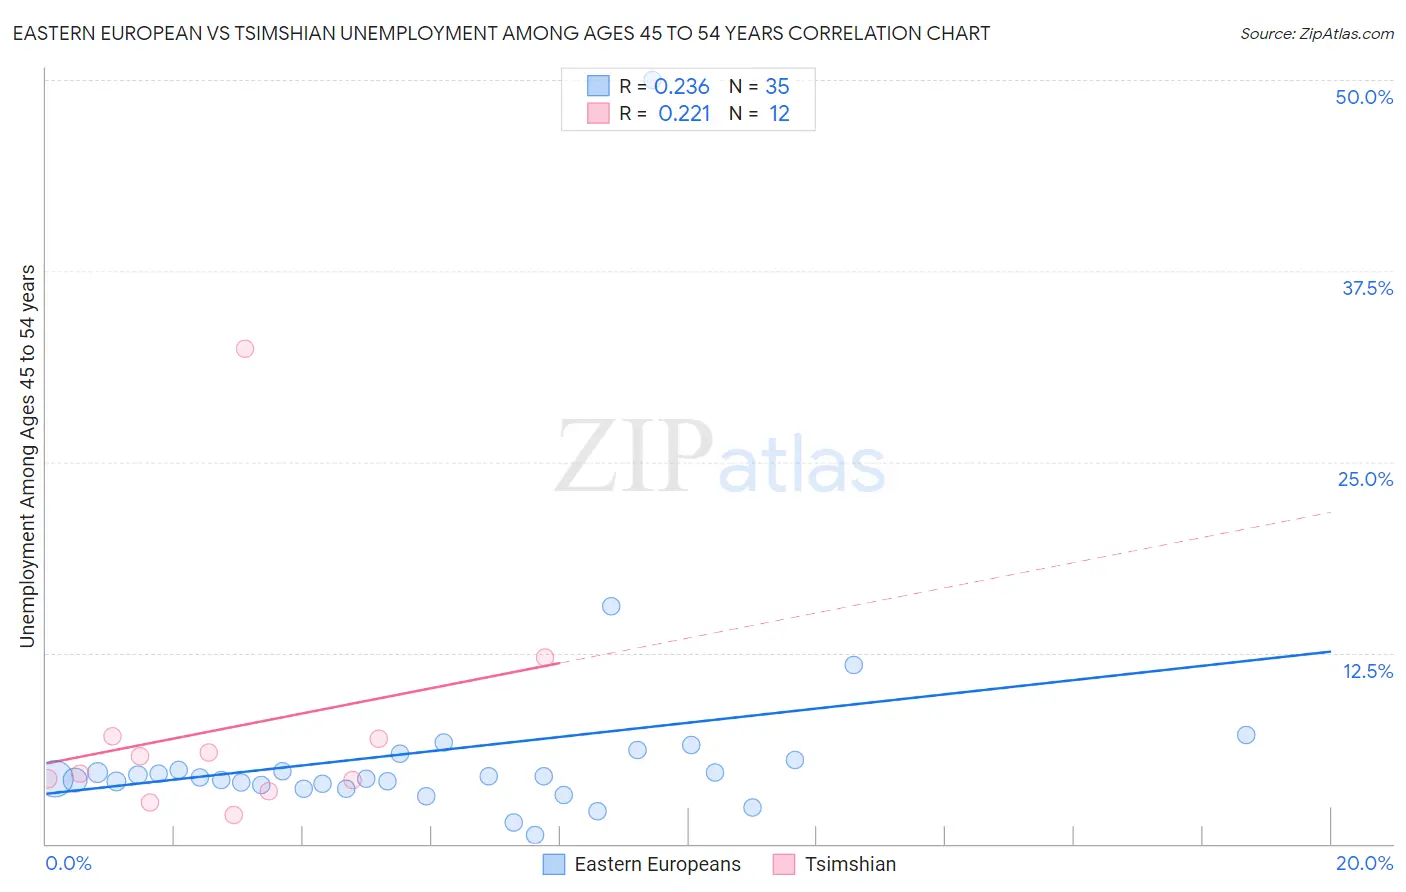
Eastern European vs Tsimshian Unemployment Among Ages 45 to 54 years Correlation Chart
The statistical analysis conducted on geographies consisting of 442,490,156 people shows a weak positive correlation between the proportion of Eastern Europeans and unemployment rate among population between the ages 45 and 54 in the United States with a correlation coefficient (R) of 0.236 and weighted average of 4.3%. Similarly, the statistical analysis conducted on geographies consisting of 15,556,119 people shows a weak positive correlation between the proportion of Tsimshian and unemployment rate among population between the ages 45 and 54 in the United States with a correlation coefficient (R) of 0.221 and weighted average of 4.5%, a difference of 3.2%.
Unemployment Among Ages 45 to 54 years Correlation Summary
| Measurement | Eastern European | Tsimshian |
| Minimum | 0.60% | 1.9% |
| Maximum | 50.0% | 32.4% |
| Range | 49.4% | 30.5% |
| Mean | 6.1% | 7.6% |
| Median | 4.3% | 5.2% |
| Interquartile 25% (IQ1) | 3.9% | 3.8% |
| Interquartile 75% (IQ3) | 5.5% | 7.0% |
| Interquartile Range (IQR) | 1.6% | 3.2% |
| Standard Deviation (Sample) | 8.1% | 8.3% |
| Standard Deviation (Population) | 8.0% | 7.9% |
Similar Demographics by Unemployment Among Ages 45 to 54 years
Demographics Similar to Eastern Europeans by Unemployment Among Ages 45 to 54 years
In terms of unemployment among ages 45 to 54 years, the demographic groups most similar to Eastern Europeans are Immigrants from Micronesia (4.3%, a difference of 0.030%), Australian (4.3%, a difference of 0.080%), Cambodian (4.3%, a difference of 0.12%), Italian (4.3%, a difference of 0.12%), and French (4.3%, a difference of 0.12%).
| Demographics | Rating | Rank | Unemployment Among Ages 45 to 54 years |
| Kenyans | 98.1 /100 | #75 | Exceptional 4.3% |
| Slavs | 98.1 /100 | #76 | Exceptional 4.3% |
| Chileans | 98.1 /100 | #77 | Exceptional 4.3% |
| German Russians | 97.9 /100 | #78 | Exceptional 4.3% |
| Serbians | 97.9 /100 | #79 | Exceptional 4.3% |
| Cambodians | 97.8 /100 | #80 | Exceptional 4.3% |
| Immigrants | Micronesia | 97.6 /100 | #81 | Exceptional 4.3% |
| Eastern Europeans | 97.6 /100 | #82 | Exceptional 4.3% |
| Australians | 97.4 /100 | #83 | Exceptional 4.3% |
| Italians | 97.3 /100 | #84 | Exceptional 4.3% |
| French | 97.3 /100 | #85 | Exceptional 4.3% |
| Ethiopians | 97.2 /100 | #86 | Exceptional 4.3% |
| Sudanese | 97.0 /100 | #87 | Exceptional 4.3% |
| Immigrants | Turkey | 96.9 /100 | #88 | Exceptional 4.3% |
| Immigrants | Argentina | 96.9 /100 | #89 | Exceptional 4.3% |
Demographics Similar to Tsimshian by Unemployment Among Ages 45 to 54 years
In terms of unemployment among ages 45 to 54 years, the demographic groups most similar to Tsimshian are Cypriot (4.5%, a difference of 0.010%), Immigrants from Austria (4.5%, a difference of 0.040%), Costa Rican (4.5%, a difference of 0.040%), Korean (4.5%, a difference of 0.10%), and Hungarian (4.5%, a difference of 0.10%).
| Demographics | Rating | Rank | Unemployment Among Ages 45 to 54 years |
| Macedonians | 79.0 /100 | #143 | Good 4.5% |
| Taiwanese | 77.9 /100 | #144 | Good 4.5% |
| Immigrants | Latvia | 77.5 /100 | #145 | Good 4.5% |
| Syrians | 77.3 /100 | #146 | Good 4.5% |
| Uruguayans | 76.9 /100 | #147 | Good 4.5% |
| Immigrants | Austria | 75.3 /100 | #148 | Good 4.5% |
| Costa Ricans | 75.3 /100 | #149 | Good 4.5% |
| Tsimshian | 74.6 /100 | #150 | Good 4.5% |
| Cypriots | 74.4 /100 | #151 | Good 4.5% |
| Koreans | 73.1 /100 | #152 | Good 4.5% |
| Hungarians | 73.0 /100 | #153 | Good 4.5% |
| Immigrants | Spain | 72.5 /100 | #154 | Good 4.5% |
| Marshallese | 70.6 /100 | #155 | Good 4.5% |
| Immigrants | Croatia | 69.6 /100 | #156 | Good 4.5% |
| Indians (Asian) | 68.1 /100 | #157 | Good 4.5% |