Immigrants from Venezuela vs Arapaho Unemployment Among Ages 65 to 74 years
COMPARE
Immigrants from Venezuela
Arapaho
Unemployment Among Ages 65 to 74 years
Unemployment Among Ages 65 to 74 years Comparison
Immigrants from Venezuela
Arapaho
5.9%
UNEMPLOYMENT AMONG AGES 65 TO 74 YEARS
0.0/ 100
METRIC RATING
314th/ 347
METRIC RANK
5.8%
UNEMPLOYMENT AMONG AGES 65 TO 74 YEARS
0.0/ 100
METRIC RATING
303rd/ 347
METRIC RANK
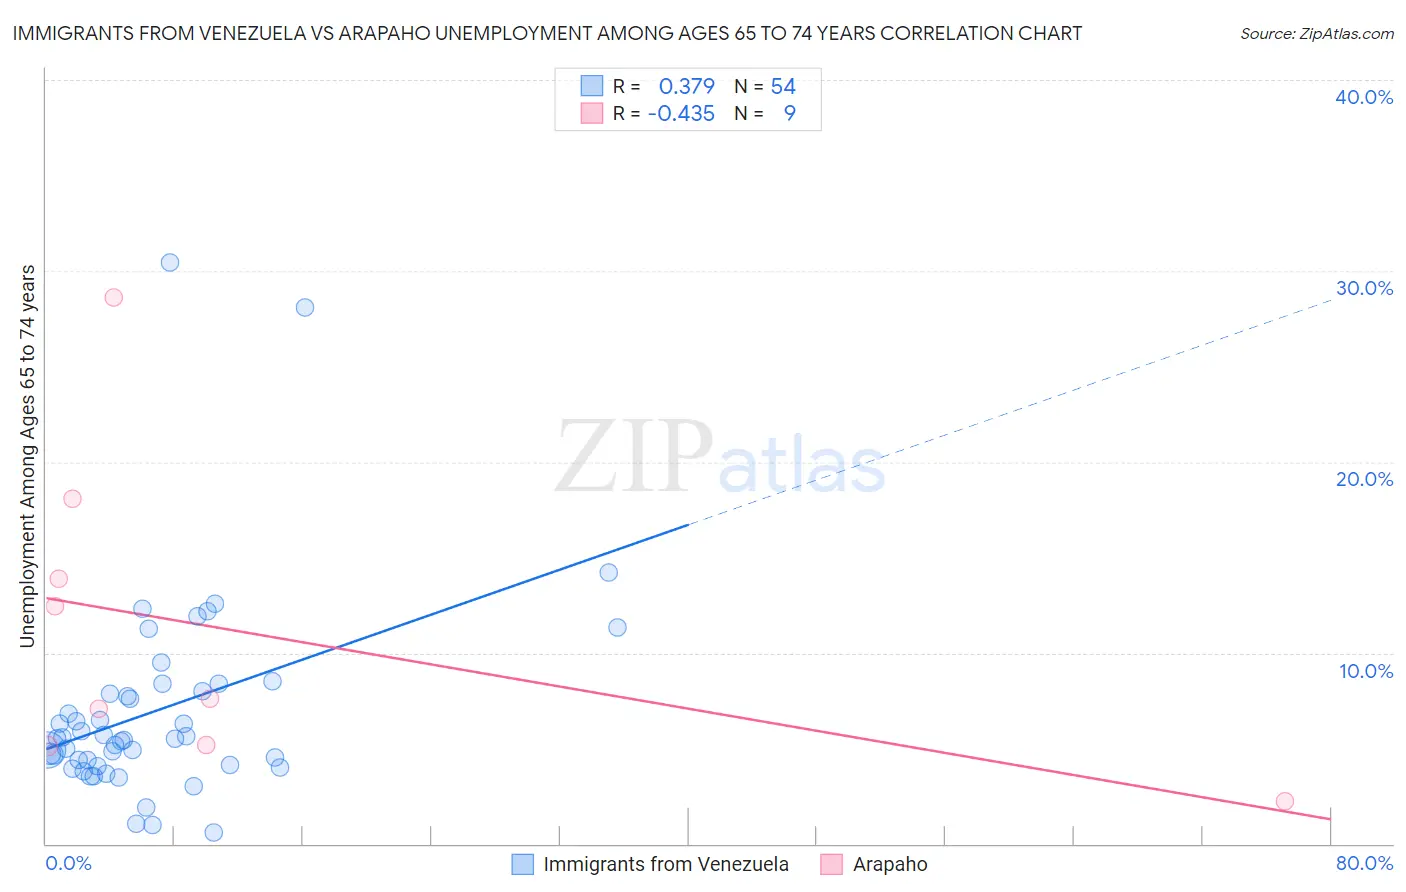
Immigrants from Venezuela vs Arapaho Unemployment Among Ages 65 to 74 years Correlation Chart
The statistical analysis conducted on geographies consisting of 263,535,725 people shows a mild positive correlation between the proportion of Immigrants from Venezuela and unemployment rate among population between the ages 65 and 74 in the United States with a correlation coefficient (R) of 0.379 and weighted average of 5.9%. Similarly, the statistical analysis conducted on geographies consisting of 27,847,458 people shows a moderate negative correlation between the proportion of Arapaho and unemployment rate among population between the ages 65 and 74 in the United States with a correlation coefficient (R) of -0.435 and weighted average of 5.8%, a difference of 0.72%.
Unemployment Among Ages 65 to 74 years Correlation Summary
| Measurement | Immigrants from Venezuela | Arapaho |
| Minimum | 0.60% | 2.2% |
| Maximum | 30.4% | 28.6% |
| Range | 29.8% | 26.4% |
| Mean | 7.0% | 11.1% |
| Median | 5.5% | 7.6% |
| Interquartile 25% (IQ1) | 4.1% | 5.2% |
| Interquartile 75% (IQ3) | 8.0% | 16.0% |
| Interquartile Range (IQR) | 3.9% | 10.8% |
| Standard Deviation (Sample) | 5.4% | 8.2% |
| Standard Deviation (Population) | 5.3% | 7.8% |
Demographics Similar to Immigrants from Venezuela and Arapaho by Unemployment Among Ages 65 to 74 years
In terms of unemployment among ages 65 to 74 years, the demographic groups most similar to Immigrants from Venezuela are Immigrants from Guatemala (5.9%, a difference of 0.010%), Vietnamese (5.9%, a difference of 0.17%), Immigrants from El Salvador (5.9%, a difference of 0.33%), Hispanic or Latino (5.9%, a difference of 0.37%), and Venezuelan (5.9%, a difference of 0.39%). Similarly, the demographic groups most similar to Arapaho are Salvadoran (5.8%, a difference of 0.0%), Liberian (5.8%, a difference of 0.020%), Mexican (5.8%, a difference of 0.020%), Cheyenne (5.8%, a difference of 0.020%), and British West Indian (5.8%, a difference of 0.020%).
| Demographics | Rating | Rank | Unemployment Among Ages 65 to 74 years |
| Immigrants | Latin America | 0.0 /100 | #298 | Tragic 5.8% |
| Barbadians | 0.0 /100 | #299 | Tragic 5.8% |
| Ecuadorians | 0.0 /100 | #300 | Tragic 5.8% |
| Armenians | 0.0 /100 | #301 | Tragic 5.8% |
| Liberians | 0.0 /100 | #302 | Tragic 5.8% |
| Arapaho | 0.0 /100 | #303 | Tragic 5.8% |
| Salvadorans | 0.0 /100 | #304 | Tragic 5.8% |
| Mexicans | 0.0 /100 | #305 | Tragic 5.8% |
| Cheyenne | 0.0 /100 | #306 | Tragic 5.8% |
| British West Indians | 0.0 /100 | #307 | Tragic 5.8% |
| Guatemalans | 0.0 /100 | #308 | Tragic 5.8% |
| Immigrants | Ecuador | 0.0 /100 | #309 | Tragic 5.8% |
| Immigrants | Bangladesh | 0.0 /100 | #310 | Tragic 5.9% |
| Venezuelans | 0.0 /100 | #311 | Tragic 5.9% |
| Hispanics or Latinos | 0.0 /100 | #312 | Tragic 5.9% |
| Vietnamese | 0.0 /100 | #313 | Tragic 5.9% |
| Immigrants | Venezuela | 0.0 /100 | #314 | Tragic 5.9% |
| Immigrants | Guatemala | 0.0 /100 | #315 | Tragic 5.9% |
| Immigrants | El Salvador | 0.0 /100 | #316 | Tragic 5.9% |
| Immigrants | Central America | 0.0 /100 | #317 | Tragic 5.9% |
| Zimbabweans | 0.0 /100 | #318 | Tragic 5.9% |