Immigrants from Ukraine vs Yup'ik Unemployment Among Ages 65 to 74 years
COMPARE
Immigrants from Ukraine
Yup'ik
Unemployment Among Ages 65 to 74 years
Unemployment Among Ages 65 to 74 years Comparison
Immigrants from Ukraine
Yup'ik
5.3%
UNEMPLOYMENT AMONG AGES 65 TO 74 YEARS
87.5/ 100
METRIC RATING
124th/ 347
METRIC RANK
9.5%
UNEMPLOYMENT AMONG AGES 65 TO 74 YEARS
0.0/ 100
METRIC RATING
346th/ 347
METRIC RANK
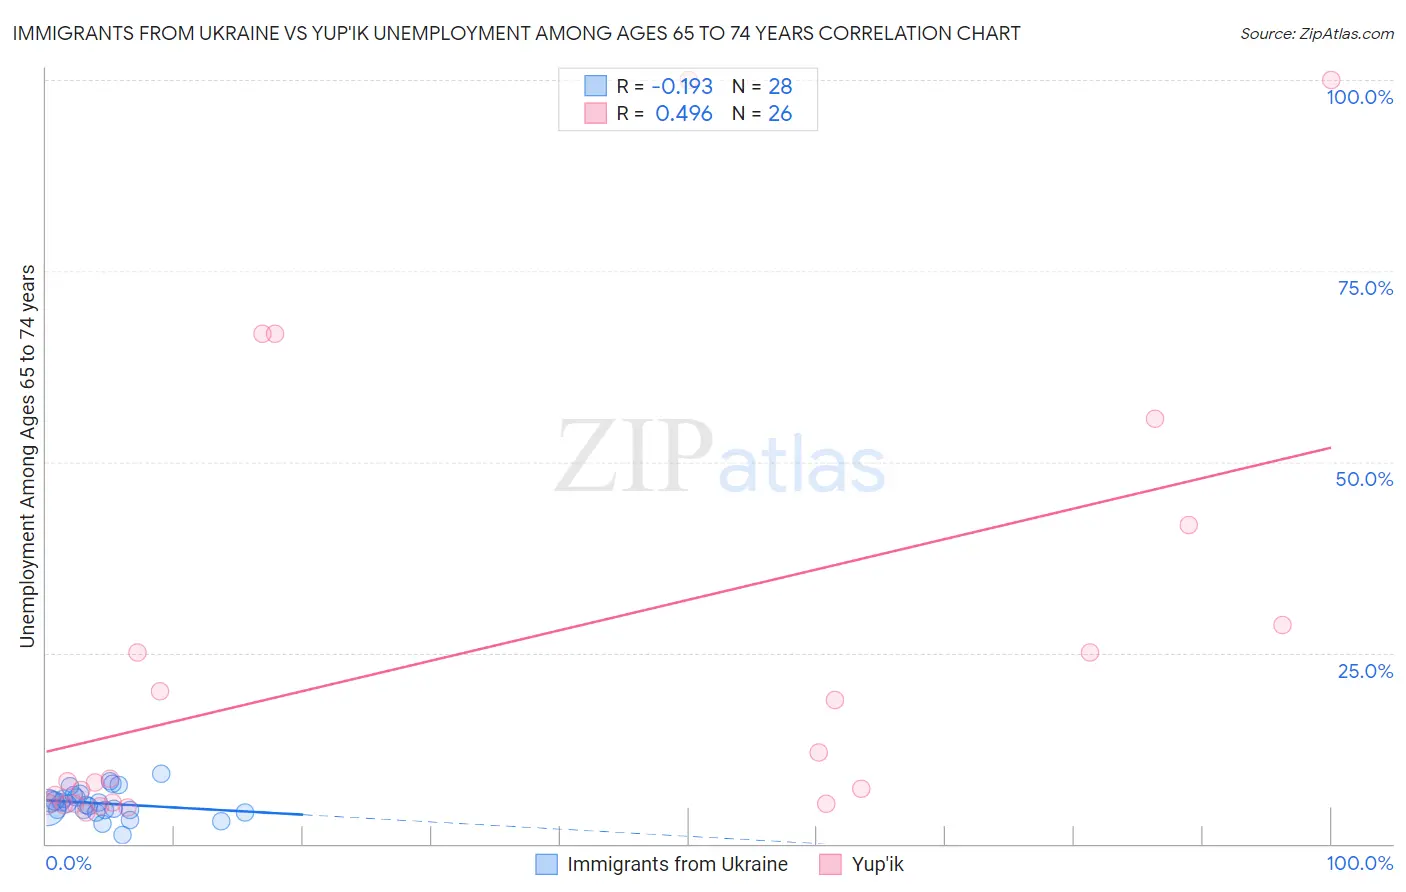
Immigrants from Ukraine vs Yup'ik Unemployment Among Ages 65 to 74 years Correlation Chart
The statistical analysis conducted on geographies consisting of 264,575,901 people shows a poor negative correlation between the proportion of Immigrants from Ukraine and unemployment rate among population between the ages 65 and 74 in the United States with a correlation coefficient (R) of -0.193 and weighted average of 5.3%. Similarly, the statistical analysis conducted on geographies consisting of 38,042,945 people shows a moderate positive correlation between the proportion of Yup'ik and unemployment rate among population between the ages 65 and 74 in the United States with a correlation coefficient (R) of 0.496 and weighted average of 9.5%, a difference of 79.2%.
Unemployment Among Ages 65 to 74 years Correlation Summary
| Measurement | Immigrants from Ukraine | Yup'ik |
| Minimum | 1.2% | 4.1% |
| Maximum | 9.1% | 100.0% |
| Range | 7.9% | 95.9% |
| Mean | 5.3% | 24.8% |
| Median | 5.2% | 8.4% |
| Interquartile 25% (IQ1) | 4.4% | 5.3% |
| Interquartile 75% (IQ3) | 6.2% | 28.6% |
| Interquartile Range (IQR) | 1.8% | 23.3% |
| Standard Deviation (Sample) | 1.8% | 29.1% |
| Standard Deviation (Population) | 1.7% | 28.6% |
Similar Demographics by Unemployment Among Ages 65 to 74 years
Demographics Similar to Immigrants from Ukraine by Unemployment Among Ages 65 to 74 years
In terms of unemployment among ages 65 to 74 years, the demographic groups most similar to Immigrants from Ukraine are Pakistani (5.3%, a difference of 0.010%), Immigrants from South Eastern Asia (5.3%, a difference of 0.030%), Immigrants from North America (5.3%, a difference of 0.070%), Immigrants from Hong Kong (5.3%, a difference of 0.080%), and Czechoslovakian (5.3%, a difference of 0.090%).
| Demographics | Rating | Rank | Unemployment Among Ages 65 to 74 years |
| Immigrants | Korea | 90.2 /100 | #117 | Exceptional 5.3% |
| Immigrants | Belarus | 90.1 /100 | #118 | Exceptional 5.3% |
| Immigrants | Fiji | 89.9 /100 | #119 | Excellent 5.3% |
| Immigrants | Switzerland | 89.9 /100 | #120 | Excellent 5.3% |
| Immigrants | Australia | 89.1 /100 | #121 | Excellent 5.3% |
| Immigrants | Canada | 89.0 /100 | #122 | Excellent 5.3% |
| Czechoslovakians | 88.6 /100 | #123 | Excellent 5.3% |
| Immigrants | Ukraine | 87.5 /100 | #124 | Excellent 5.3% |
| Pakistanis | 87.5 /100 | #125 | Excellent 5.3% |
| Immigrants | South Eastern Asia | 87.2 /100 | #126 | Excellent 5.3% |
| Immigrants | North America | 86.7 /100 | #127 | Excellent 5.3% |
| Immigrants | Hong Kong | 86.5 /100 | #128 | Excellent 5.3% |
| Immigrants | England | 86.2 /100 | #129 | Excellent 5.3% |
| Eastern Europeans | 85.6 /100 | #130 | Excellent 5.3% |
| Immigrants | Russia | 83.0 /100 | #131 | Excellent 5.3% |
Demographics Similar to Yup'ik by Unemployment Among Ages 65 to 74 years
In terms of unemployment among ages 65 to 74 years, the demographic groups most similar to Yup'ik are Immigrants from Yemen (8.3%, a difference of 14.6%), Inupiat (7.5%, a difference of 26.3%), Alaskan Athabascan (7.4%, a difference of 28.7%), Navajo (6.9%, a difference of 36.6%), and Alaska Native (6.8%, a difference of 38.6%).
| Demographics | Rating | Rank | Unemployment Among Ages 65 to 74 years |
| Paiute | 0.0 /100 | #333 | Tragic 6.3% |
| Taiwanese | 0.0 /100 | #334 | Tragic 6.3% |
| Puerto Ricans | 0.0 /100 | #335 | Tragic 6.4% |
| Immigrants | Armenia | 0.0 /100 | #336 | Tragic 6.5% |
| Ute | 0.0 /100 | #337 | Tragic 6.5% |
| Tlingit-Haida | 0.0 /100 | #338 | Tragic 6.5% |
| Yakama | 0.0 /100 | #339 | Tragic 6.6% |
| Pima | 0.0 /100 | #340 | Tragic 6.6% |
| Alaska Natives | 0.0 /100 | #341 | Tragic 6.8% |
| Navajo | 0.0 /100 | #342 | Tragic 6.9% |
| Alaskan Athabascans | 0.0 /100 | #343 | Tragic 7.4% |
| Inupiat | 0.0 /100 | #344 | Tragic 7.5% |
| Immigrants | Yemen | 0.0 /100 | #345 | Tragic 8.3% |
| Yup'ik | 0.0 /100 | #346 | Tragic 9.5% |
| Crow | 0.0 /100 | #347 | Tragic 17.4% |