Immigrants from Ukraine vs Immigrants from Fiji Unemployment Among Ages 65 to 74 years
COMPARE
Immigrants from Ukraine
Immigrants from Fiji
Unemployment Among Ages 65 to 74 years
Unemployment Among Ages 65 to 74 years Comparison
Immigrants from Ukraine
Immigrants from Fiji
5.3%
UNEMPLOYMENT AMONG AGES 65 TO 74 YEARS
87.5/ 100
METRIC RATING
124th/ 347
METRIC RANK
5.3%
UNEMPLOYMENT AMONG AGES 65 TO 74 YEARS
89.9/ 100
METRIC RATING
119th/ 347
METRIC RANK
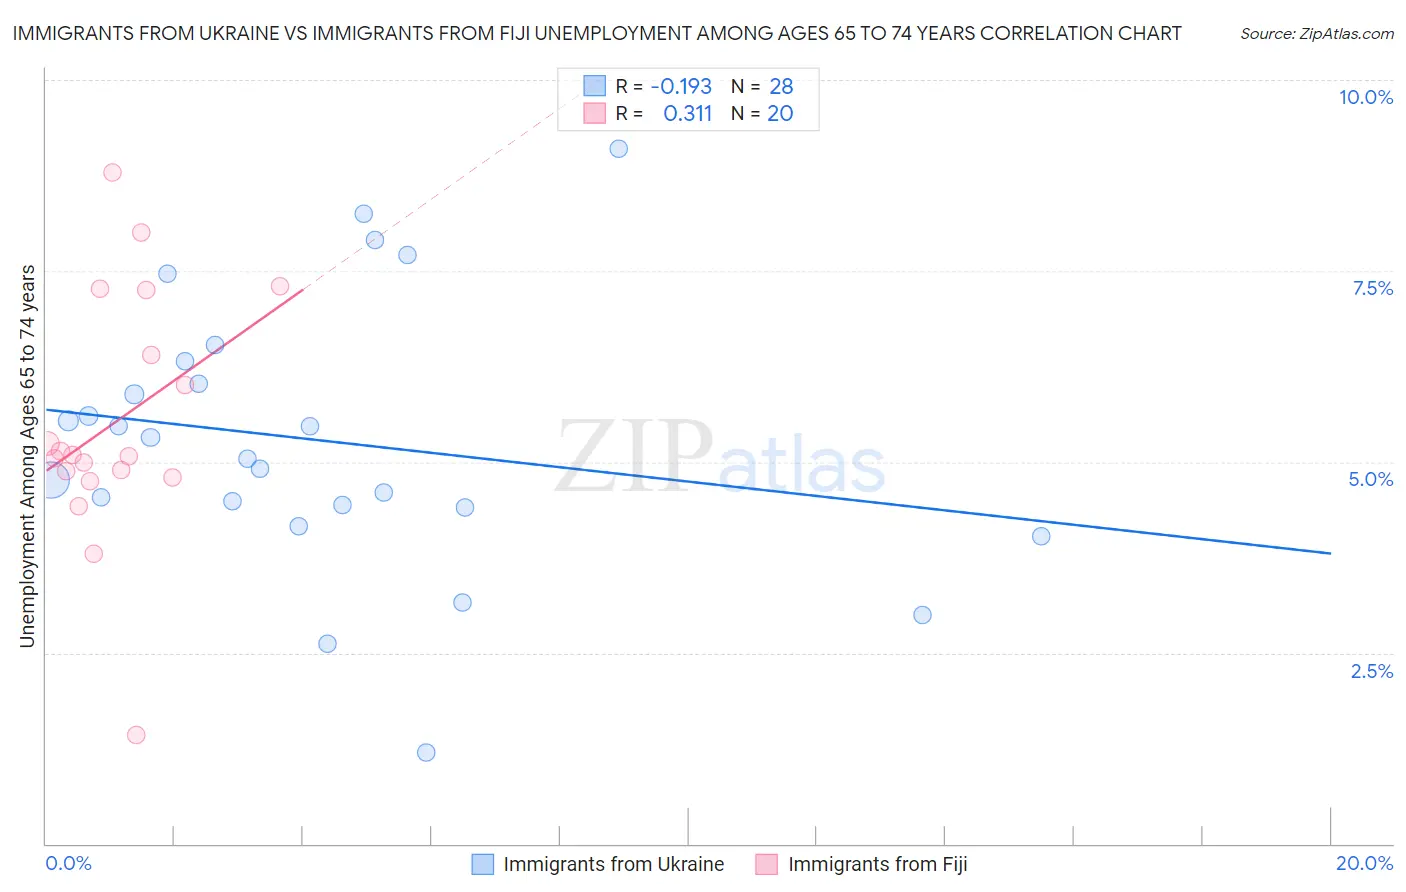
Immigrants from Ukraine vs Immigrants from Fiji Unemployment Among Ages 65 to 74 years Correlation Chart
The statistical analysis conducted on geographies consisting of 264,575,901 people shows a poor negative correlation between the proportion of Immigrants from Ukraine and unemployment rate among population between the ages 65 and 74 in the United States with a correlation coefficient (R) of -0.193 and weighted average of 5.3%. Similarly, the statistical analysis conducted on geographies consisting of 90,875,460 people shows a mild positive correlation between the proportion of Immigrants from Fiji and unemployment rate among population between the ages 65 and 74 in the United States with a correlation coefficient (R) of 0.311 and weighted average of 5.3%, a difference of 0.20%.
Unemployment Among Ages 65 to 74 years Correlation Summary
| Measurement | Immigrants from Ukraine | Immigrants from Fiji |
| Minimum | 1.2% | 1.4% |
| Maximum | 9.1% | 8.8% |
| Range | 7.9% | 7.4% |
| Mean | 5.3% | 5.5% |
| Median | 5.2% | 5.1% |
| Interquartile 25% (IQ1) | 4.4% | 4.8% |
| Interquartile 75% (IQ3) | 6.2% | 6.8% |
| Interquartile Range (IQR) | 1.8% | 2.0% |
| Standard Deviation (Sample) | 1.8% | 1.6% |
| Standard Deviation (Population) | 1.7% | 1.6% |
Demographics Similar to Immigrants from Ukraine and Immigrants from Fiji by Unemployment Among Ages 65 to 74 years
In terms of unemployment among ages 65 to 74 years, the demographic groups most similar to Immigrants from Ukraine are Pakistani (5.3%, a difference of 0.010%), Immigrants from South Eastern Asia (5.3%, a difference of 0.030%), Immigrants from North America (5.3%, a difference of 0.070%), Immigrants from Hong Kong (5.3%, a difference of 0.080%), and Czechoslovakian (5.3%, a difference of 0.090%). Similarly, the demographic groups most similar to Immigrants from Fiji are Immigrants from Switzerland (5.3%, a difference of 0.0%), Immigrants from Belarus (5.3%, a difference of 0.010%), Immigrants from Korea (5.3%, a difference of 0.030%), Australian (5.3%, a difference of 0.050%), and Immigrants from Australia (5.3%, a difference of 0.070%).
| Demographics | Rating | Rank | Unemployment Among Ages 65 to 74 years |
| Sri Lankans | 92.7 /100 | #111 | Exceptional 5.3% |
| Immigrants | South Central Asia | 92.4 /100 | #112 | Exceptional 5.3% |
| Immigrants | Germany | 91.6 /100 | #113 | Exceptional 5.3% |
| Asians | 91.1 /100 | #114 | Exceptional 5.3% |
| Immigrants | Turkey | 90.8 /100 | #115 | Exceptional 5.3% |
| Australians | 90.4 /100 | #116 | Exceptional 5.3% |
| Immigrants | Korea | 90.2 /100 | #117 | Exceptional 5.3% |
| Immigrants | Belarus | 90.1 /100 | #118 | Exceptional 5.3% |
| Immigrants | Fiji | 89.9 /100 | #119 | Excellent 5.3% |
| Immigrants | Switzerland | 89.9 /100 | #120 | Excellent 5.3% |
| Immigrants | Australia | 89.1 /100 | #121 | Excellent 5.3% |
| Immigrants | Canada | 89.0 /100 | #122 | Excellent 5.3% |
| Czechoslovakians | 88.6 /100 | #123 | Excellent 5.3% |
| Immigrants | Ukraine | 87.5 /100 | #124 | Excellent 5.3% |
| Pakistanis | 87.5 /100 | #125 | Excellent 5.3% |
| Immigrants | South Eastern Asia | 87.2 /100 | #126 | Excellent 5.3% |
| Immigrants | North America | 86.7 /100 | #127 | Excellent 5.3% |
| Immigrants | Hong Kong | 86.5 /100 | #128 | Excellent 5.3% |
| Immigrants | England | 86.2 /100 | #129 | Excellent 5.3% |
| Eastern Europeans | 85.6 /100 | #130 | Excellent 5.3% |
| Immigrants | Russia | 83.0 /100 | #131 | Excellent 5.3% |